
Page 183 - Statistics II for Dummies
P. 183
Chapter 9: Testing Lots of Means? Come On Over to ANOVA!
zero and are skewed to the right. The degree of curvature and the height of 167
the curvature of each F-distribution is reflected in two degrees of freedom,
represented by k – 1 and n – k. (These come from the denominators of MST
and MSE, respectively, where n is the total sample size and k is the total
number of treatments or populations.) A shorthand way of denoting the
F-distribution for this test is F .
(k – 1, n – k)
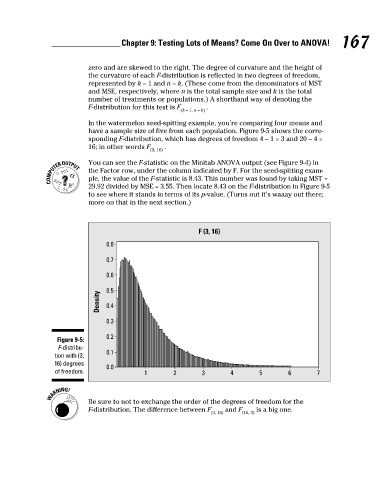
In the watermelon seed-spitting example, you’re comparing four means and
have a sample size of five from each population. Figure 9-5 shows the corre-
sponding F-distribution, which has degrees of freedom 4 – 1 = 3 and 20 – 4 =
16; in other words F .
(3, 16)
You can see the F-statistic on the Minitab ANOVA output (see Figure 9-4) in
the Factor row, under the column indicated by F. For the seed-spitting exam-
ple, the value of the F-statistic is 8.43. This number was found by taking MST =
29.92 divided by MSE = 3.55. Then locate 8.43 on the F-distribution in Figure 9-5
to see where it stands in terms of its p-value. (Turns out it’s waaay out there;
more on that in the next section.)
F (3, 16)
0.8
0.7
0.6
0.5
Density 0.4
0.3
0.2
Figure 9-5:
F-distribu-
0.1
tion with (3,
16) degrees
0.0
of freedom. 1 2 3 4 5 6 7
Be sure to not to exchange the order of the degrees of freedom for the
F-distribution. The difference between F and F is a big one.
(3, 16) (16, 3)
7/23/09 9:31:30 PM
15_466469-ch09.indd 167
15_466469-ch09.indd 167 7/23/09 9:31:30 PM