Page 191 - Statistics II for Dummies
P. 191

Chapter 10: Sorting Out the Means with Multiple Comparisons  175


                                   Table 10-1          Cellphone Minutes Used in One Month
                                  19 and Under     20–39 (Group 2)  40–59 (Group 3)  60 and Over
                                  (Group 1)                                          (Group 4)
                                  800              250              700              200
                                  850              350              700              120
                                  800              375              750              150
                                  650              320              650              90
                                  750              430              550              20
                                  680              380              580              150
                                  800              325              700              200
                                  750              410              700              130
                                  690              450              590              160
                                  710              390              650              30


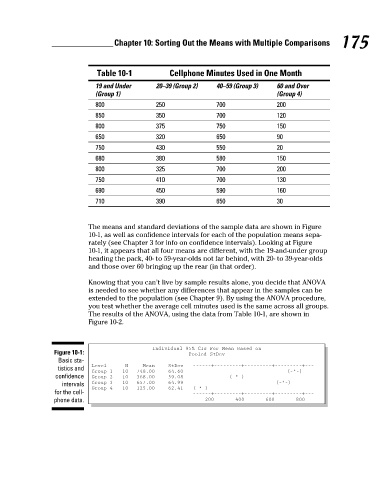
                                The means and standard deviations of the sample data are shown in Figure
                                10-1, as well as confidence intervals for each of the population means sepa-
                                rately (see Chapter 3 for info on confidence intervals). Looking at Figure
                                10-1, it appears that all four means are different, with the 19-and-under group
                                heading the pack, 40- to 59-year-olds not far behind, with 20- to 39-year-olds
                                and those over 60 bringing up the rear (in that order).
                                Knowing that you can’t live by sample results alone, you decide that ANOVA
                                is needed to see whether any differences that appear in the samples can be
                                extended to the population (see Chapter 9). By using the ANOVA procedure,
                                you test whether the average cell minutes used is the same across all groups.
                                The results of the ANOVA, using the data from Table 10-1, are shown in
                                Figure 10-2.


                                                  Individual 95% CIs For Mean Based on
                       Figure 10-1:                         Pooled StDev
                        Basic sta-
                                 Level    N    Mean   StDev   ––––––+–––––––––+–––––––––+–––––––––+–––
                        tistics and
                                 Group 1   10   748.00   64.60                          (–*–)
                       confidence   Group 2   10   368.00   59.08               (–*–)
                         intervals   Group 3   10   657.00   64.99                               (–*–)
                                 Group 4   10   125.00   62.41   (–*–)
                       for the cell-                          ––––––+–––––––––+–––––––––+–––––––––+–––
                       phone data.                                200        400       600       800


          16_466469-ch10.indd   175                                                                   7/24/09   9:41:31 AM
   186   187   188   189   190   191   192   193   194   195   196