
Page 196 - Statistics II for Dummies
P. 196
180 Part III: Analyzing Variance with ANOVA
An ANOVA procedure was done on the cellphone data presented in Table
10-1 to compare the mean number of minutes used for four age groups.
Looking at the output in Figure 10-2, you see Ho (all the population means
are equal) was rejected. The next step is to conduct multiple comparisons by
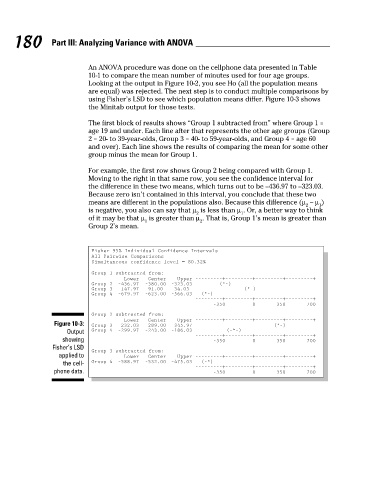
using Fisher’s LSD to see which population means differ. Figure 10-3 shows
the Minitab output for those tests.
The first block of results shows “Group 1 subtracted from” where Group 1 =
age 19 and under. Each line after that represents the other age groups (Group
2 = 20- to 39-year-olds, Group 3 = 40- to 59-year-olds, and Group 4 = age 60
and over). Each line shows the results of comparing the mean for some other
group minus the mean for Group 1.
For example, the first row shows Group 2 being compared with Group 1.
Moving to the right in that same row, you see the confidence interval for
the difference in these two means, which turns out to be –436.97 to –323.03.
Because zero isn’t contained in this interval, you conclude that these two
means are different in the populations also. Because this difference (μ – μ )
2 1
is negative, you also can say that μ is less than μ . Or, a better way to think
2 1
of it may be that μ is greater than μ . That is, Group 1’s mean is greater than
1 2
Group 2’s mean.
Fisher 95% Individual Confidence Intervals
All Pairwise Comparisons
Simultaneous confidence level = 80.32%
Group 1 subtracted from:
Lower Center Upper –––––––––+–––––––––+–––––––––+–––––––––+
Group 2 –436.97 –380.00 –323.03 (*–)
Group 3 –147.97 –91.00 –34.03 (*–)
Group 4 –679.97 –623.00 –566.03 (*–)
–––––––––+–––––––––+–––––––––+–––––––––+
–350 0 350 700
Group 2 subtracted from:
Lower Center Upper –––––––––+–––––––––+–––––––––+–––––––––+
Figure 10-3: Group 3 232.03 289.00 345.97 (*–)
Output Group 4 –299.97 –243.00 –186.03 (–*–)
–––––––––+–––––––––+–––––––––+–––––––––+
showing –350 0 350 700
Fisher’s LSD
Group 3 subtracted from:
applied to Lower Center Upper –––––––––+–––––––––+–––––––––+–––––––––+
the cell- Group 4 –588.97 –532.00 –475.03 (–*)
–––––––––+–––––––––+–––––––––+–––––––––+
phone data. –350 0 350 700
16_466469-ch10.indd 180 7/24/09 9:41:38 AM