
Page 197 - Statistics II for Dummies
P. 197
Chapter 10: Sorting Out the Means with Multiple Comparisons 181
If two means are equal, their difference equals zero, and a confidence inter-
val for the difference should contain zero. If zero isn’t included, you say the
means are different.
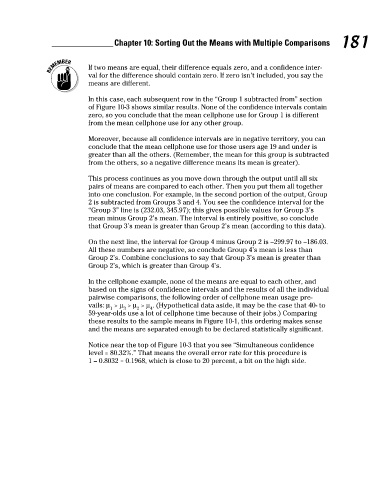
In this case, each subsequent row in the “Group 1 subtracted from” section
of Figure 10-3 shows similar results. None of the confidence intervals contain
zero, so you conclude that the mean cellphone use for Group 1 is different
from the mean cellphone use for any other group.
Moreover, because all confidence intervals are in negative territory, you can
conclude that the mean cellphone use for those users age 19 and under is
greater than all the others. (Remember, the mean for this group is subtracted
from the others, so a negative difference means its mean is greater).
This process continues as you move down through the output until all six
pairs of means are compared to each other. Then you put them all together
into one conclusion. For example, in the second portion of the output, Group
2 is subtracted from Groups 3 and 4. You see the confidence interval for the
“Group 3” line is (232.03, 345.97); this gives possible values for Group 3’s
mean minus Group 2’s mean. The interval is entirely positive, so conclude
that Group 3’s mean is greater than Group 2’s mean (according to this data).
On the next line, the interval for Group 4 minus Group 2 is –299.97 to –186.03.
All these numbers are negative, so conclude Group 4’s mean is less than
Group 2’s. Combine conclusions to say that Group 3’s mean is greater than
Group 2’s, which is greater than Group 4’s.
In the cellphone example, none of the means are equal to each other, and
based on the signs of confidence intervals and the results of all the individual
pairwise comparisons, the following order of cellphone mean usage pre-
vails: μ > μ > μ > μ . (Hypothetical data aside, it may be the case that 40- to
1 3 2 4
59-year-olds use a lot of cellphone time because of their jobs.) Comparing
these results to the sample means in Figure 10-1, this ordering makes sense
and the means are separated enough to be declared statistically significant.
Notice near the top of Figure 10-3 that you see “Simultaneous confidence
level = 80.32%.” That means the overall error rate for this procedure is
1 – 0.8032 = 0.1968, which is close to 20 percent, a bit on the high side.
16_466469-ch10.indd 181 7/24/09 9:41:39 AM