
Page 199 - Statistics II for Dummies
P. 199
Chapter 10: Sorting Out the Means with Multiple Comparisons 183
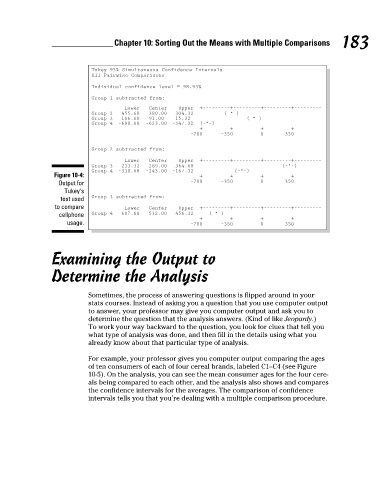
Tukey 95% Simultaneous Confidence Intervals
All Pairwise Comparisons
Individual confidence level = 98.93%
Group 1 subtracted from:
Lower Center Upper +–––––––––+–––––––––+–––––––––+–––––––––
Group 2 –455.68 –380.00 –304.32 (–*–)
Group 3 –166.68 –91.00 –15.32 (–*–)
Group 4 –698.68 –623.00 –547.32 (–*–)
+–––––––––+–––––––––+–––––––––+–––––––––
–700 –350 0 350
Group 2 subtracted from:
Lower Center Upper +–––––––––+–––––––––+–––––––––+–––––––––
Group 3 213.32 289.00 364.68 (–*-)
Group 4 –318.68 –243.00 –167.32 (–*–)
Figure 10-4: +–––––––––+–––––––––+–––––––––+–––––––––
Output for –700 –350 0 350
Tukey’s
test used Group 3 subtracted from:
to compare Lower Center Upper +–––––––––+–––––––––+–––––––––+–––––––––
cellphone Group 4 –607.68 –532.00 –456.32 (–*–)
+–––––––––+–––––––––+–––––––––+–––––––––
usage. –700 –350 0 350
Examining the Output to
Determine the Analysis
Sometimes, the process of answering questions is flipped around in your
stats courses. Instead of asking you a question that you use computer output
to answer, your professor may give you computer output and ask you to
determine the question that the analysis answers. (Kind of like Jeopardy.)
To work your way backward to the question, you look for clues that tell you
what type of analysis was done, and then fill in the details using what you
already know about that particular type of analysis.
For example, your professor gives you computer output comparing the ages
of ten consumers of each of four cereal brands, labeled C1–C4 (see Figure
10-5). On the analysis, you can see the mean consumer ages for the four cere-
als being compared to each other, and the analysis also shows and compares
the confidence intervals for the averages. The comparison of confidence
intervals tells you that you’re dealing with a multiple comparison procedure.
16_466469-ch10.indd 183 7/24/09 9:41:41 AM