
Page 210 - Statistics II for Dummies
P. 210
194 Part III: Analyzing Variance with ANOVA
Go to Stat>Anova>Two-way. Click on Column 1 in the left-hand box, and it
appears in the Response box on the right-hand side. Click on Column 2, and
it appears in the row factor box; click on Column 3, and it appears in the
column factor box. Click OK.
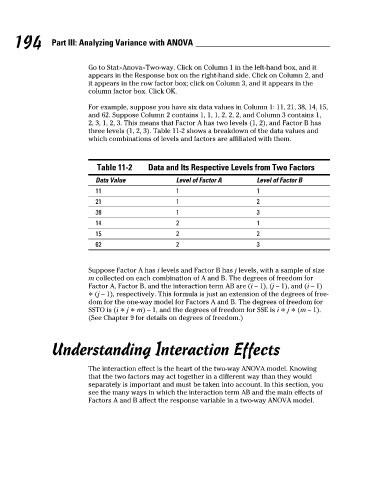
For example, suppose you have six data values in Column 1: 11, 21, 38, 14, 15,
and 62. Suppose Column 2 contains 1, 1, 1, 2, 2, 2, and Column 3 contains 1,
2, 3, 1, 2, 3. This means that Factor A has two levels (1, 2), and Factor B has
three levels (1, 2, 3). Table 11-2 shows a breakdown of the data values and
which combinations of levels and factors are affiliated with them.
Table 11-2 Data and Its Respective Levels from Two Factors
Data Value Level of Factor A Level of Factor B
11 1 1
21 1 2
38 1 3
14 2 1
15 2 2
62 2 3
Suppose Factor A has i levels and Factor B has j levels, with a sample of size
m collected on each combination of A and B. The degrees of freedom for
Factor A, Factor B, and the interaction term AB are (i – 1), (j – 1), and (i – 1)
* (j – 1), respectively. This formula is just an extension of the degrees of free-
dom for the one-way model for Factors A and B. The degrees of freedom for
SSTO is (i * j * m) – 1, and the degrees of freedom for SSE is i * j * (m – 1).
(See Chapter 9 for details on degrees of freedom.)
Understanding Interaction Effects
The interaction effect is the heart of the two-way ANOVA model. Knowing
that the two factors may act together in a different way than they would
separately is important and must be taken into account. In this section, you
see the many ways in which the interaction term AB and the main effects of
Factors A and B affect the response variable in a two-way ANOVA model.
17_466469-ch11.indd 194 7/24/09 9:44:17 AM