
Page 274 - Statistics II for Dummies
P. 274
258 Part IV: Building Strong Connections with Chi-Square Tests
Suppose that you collect data on 100 men and 100 women and find 45 male
cellphone owners and 55 female cellphone owners. This means that equals
45 ÷ 100 = 0.45, and equals 55 ÷ 100 = 0.55. Your samples have at least
five successes (having the desired characteristic; in this case, cellphone
ownership) and five failures (not having the desired characteristic, which is
cellphone ownership). So you compute the Z-statistic for comparing the two
population proportions (males versus females) based on this data; it’s –1.41,
as shown on the last line of the Minitab output in Figure 14-3.
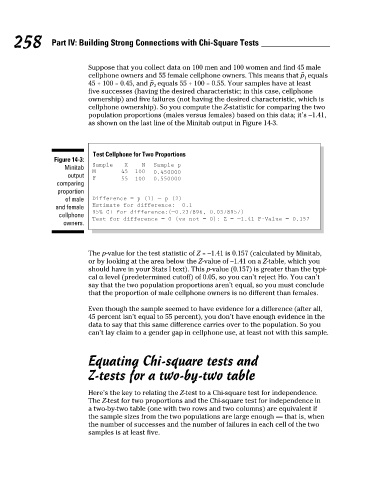
Test Cellphone for Two Proportions
Figure 14-3:
Sample X N Sample p
Minitab
M 45 100 0.450000
output
F 55 100 0.550000
comparing
proportion
of male Difference = p (1) — p (2)
and female Estimate for difference: —0.1
95% CI for difference:(—0.237896, 0.0378957)
cellphone
Test for difference = 0 (vs not = 0): Z = —1.41 P-Value = 0.157
owners.
The p-value for the test statistic of Z = –1.41 is 0.157 (calculated by Minitab,
or by looking at the area below the Z-value of –1.41 on a Z-table, which you
should have in your Stats I text). This p-value (0.157) is greater than the typi-
cal α level (predetermined cutoff) of 0.05, so you can’t reject Ho. You can’t
say that the two population proportions aren’t equal, so you must conclude
that the proportion of male cellphone owners is no different than females.
Even though the sample seemed to have evidence for a difference (after all,
45 percent isn’t equal to 55 percent), you don’t have enough evidence in the
data to say that this same difference carries over to the population. So you
can’t lay claim to a gender gap in cellphone use, at least not with this sample.
Equating Chi-square tests and
Z-tests for a two-by-two table
Here’s the key to relating the Z-test to a Chi-square test for independence.
The Z-test for two proportions and the Chi-square test for independence in
a two-by-two table (one with two rows and two columns) are equivalent if
the sample sizes from the two populations are large enough — that is, when
the number of successes and the number of failures in each cell of the two
samples is at least five.
21_466469-ch14.indd 258 7/24/09 9:51:31 AM