
Page 272 - Statistics II for Dummies
P. 272
256 Part IV: Building Strong Connections with Chi-Square Tests
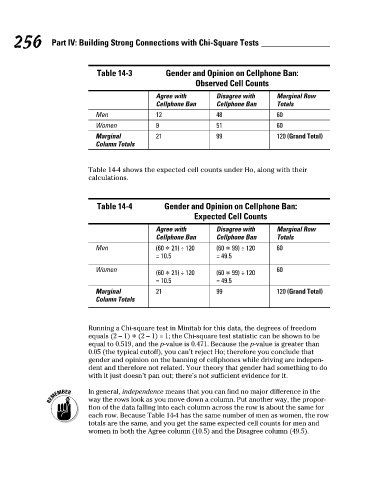
Table 14-3 Gender and Opinion on Cellphone Ban:
Observed Cell Counts
Agree with Disagree with Marginal Row
Cellphone Ban Cellphone Ban Totals
Men 12 48 60
Women 9 51 60
Marginal 21 99 120 (Grand Total)
Column Totals
Table 14-4 shows the expected cell counts under Ho, along with their
calculations.
Table 14-4 Gender and Opinion on Cellphone Ban:
Expected Cell Counts
Agree with Disagree with Marginal Row
Cellphone Ban Cellphone Ban Totals
Men (60 * 21) ÷ 120 (60 * 99) ÷ 120 60
= 10.5 = 49.5
Women 60
(60 * 21) ÷ 120 (60 * 99) ÷ 120
= 10.5 = 49.5
Marginal 21 99 120 (Grand Total)
Column Totals
Running a Chi-square test in Minitab for this data, the degrees of freedom
equals (2 – 1) * (2 – 1) = 1; the Chi-square test statistic can be shown to be
equal to 0.519, and the p-value is 0.471. Because the p-value is greater than
0.05 (the typical cutoff), you can’t reject Ho; therefore you conclude that
gender and opinion on the banning of cellphones while driving are indepen-
dent and therefore not related. Your theory that gender had something to do
with it just doesn’t pan out; there’s not sufficient evidence for it.
In general, independence means that you can find no major difference in the
way the rows look as you move down a column. Put another way, the propor-
tion of the data falling into each column across the row is about the same for
each row. Because Table 14-4 has the same number of men as women, the row
totals are the same, and you get the same expected cell counts for men and
women in both the Agree column (10.5) and the Disagree column (49.5).
21_466469-ch14.indd 256 7/24/09 9:51:31 AM