Page 267 - Statistics II for Dummies
P. 267

Chapter 14: Being Independent Enough for the Chi-Square Test  251


                                Discovering how Chi-square distributions behave
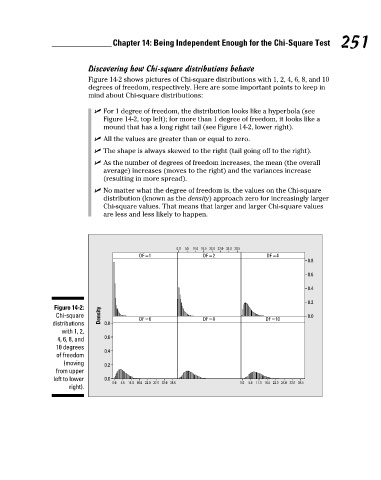
                                Figure 14-2 shows pictures of Chi-square distributions with 1, 2, 4, 6, 8, and 10
                                degrees of freedom, respectively. Here are some important points to keep in
                                mind about Chi-square distributions:

                                  ✓ For 1 degree of freedom, the distribution looks like a hyperbola (see
                                    Figure 14-2, top left); for more than 1 degree of freedom, it looks like a
                                    mound that has a long right tail (see Figure 14-2, lower right).

                                  ✓ All the values are greater than or equal to zero.
                                  ✓ The shape is always skewed to the right (tail going off to the right).
                                  ✓ As the number of degrees of freedom increases, the mean (the overall
                                    average) increases (moves to the right) and the variances increase
                                    (resulting in more spread).
                                  ✓ No matter what the degree of freedom is, the values on the Chi-square
                                    distribution (known as the density) approach zero for increasingly larger
                                    Chi-square values. That means that larger and larger Chi-square values
                                    are less and less likely to happen.


                                                         0.0  5.5 11.0 16.5 22.0 27.0 33.0 38.5
                                              DF = 1            DF = 2            DF = 4
                                                                                             0.8
                                                                                             0.6

                                                                                             0.4
                                                                                             0.2
                       Figure 14-2:
                       Chi-square   Density   DF = 6            DF = 8            DF = 10    0.0
                      distributions   0.8
                         with 1, 2,
                        4, 6, 8, and   0.6
                       10 degrees
                                     0.4
                       of freedom
                         (moving     0.2
                       from upper
                       left to lower   0.0
                                       0.0  5.5 11.0 16.5 22.0 27.0 33.0 38.5  0.0  5.5 11.0 16.5 22.0 27.0 33.0 38.5
                           right).


          21_466469-ch14.indd   251                                                                   7/24/09   9:51:30 AM
   262   263   264   265   266   267   268   269   270   271   272