
Page 262 - Statistics II for Dummies
P. 262
246 Part IV: Building Strong Connections with Chi-Square Tests
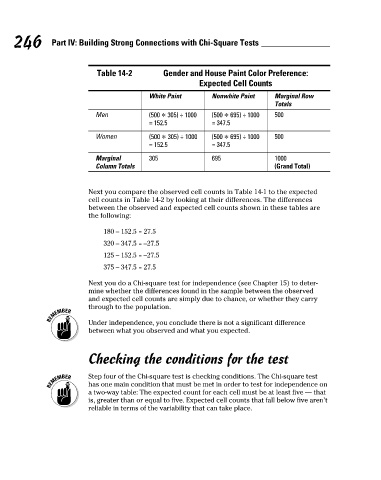
Table 14-2 Gender and House Paint Color Preference:
Expected Cell Counts
White Paint Nonwhite Paint Marginal Row
Totals
Men (500 * 305) ÷ 1000 (500 * 695) ÷ 1000 500
= 152.5 = 347.5
Women (500 * 305) ÷ 1000 (500 * 695) ÷ 1000 500
= 152.5 = 347.5
Marginal 305 695 1000
Column Totals (Grand Total)
Next you compare the observed cell counts in Table 14-1 to the expected
cell counts in Table 14-2 by looking at their differences. The differences
between the observed and expected cell counts shown in these tables are
the following:
180 – 152.5 = 27.5
320 – 347.5 = –27.5
125 – 152.5 = –27.5
375 – 347.5 = 27.5
Next you do a Chi-square test for independence (see Chapter 15) to deter-
mine whether the differences found in the sample between the observed
and expected cell counts are simply due to chance, or whether they carry
through to the population.
Under independence, you conclude there is not a significant difference
between what you observed and what you expected.
Checking the conditions for the test
Step four of the Chi-square test is checking conditions. The Chi-square test
has one main condition that must be met in order to test for independence on
a two-way table: The expected count for each cell must be at least five — that
is, greater than or equal to five. Expected cell counts that fall below five aren’t
reliable in terms of the variability that can take place.
21_466469-ch14.indd 246 7/24/09 9:51:29 AM