
Page 259 - Statistics II for Dummies
P. 259
Chapter 14: Being Independent Enough for the Chi-Square Test 243
7. If your result is less than your predetermined cutoff (the α level), usu-
ally 0.05, reject Ho and conclude dependence of the two variables.
If your result is greater than the α level, fail to reject Ho; the variables
can’t be deemed dependent.
To conduct a Chi-square test in Minitab, enter your data in the spreadsheet
exactly as it appears in your two-way table (see Chapter 13 for setting up a
two-way table for categorical data). Go to Stat>Tables>Chi-Square Test. Click
on the two variable names in the left-hand box corresponding to your column
variables in the spreadsheet. They appear in the box labeled Columns
Contained in the Table. Then click OK.
Collecting and organizing the data
The first step in any data analysis is collecting your data. In the case of two
categorical variables, you collect data on the two variables at the same time
for each individual in the study
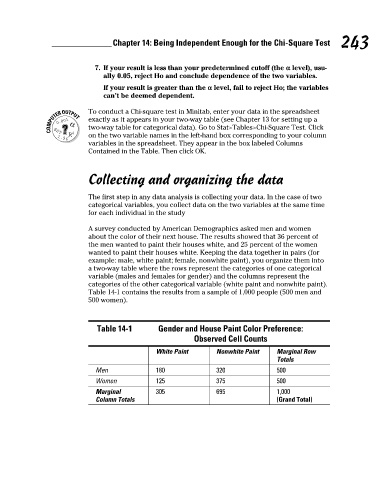
A survey conducted by American Demographics asked men and women
about the color of their next house. The results showed that 36 percent of
the men wanted to paint their houses white, and 25 percent of the women
wanted to paint their houses white. Keeping the data together in pairs (for
example: male, white paint; female, nonwhite paint), you organize them into
a two-way table where the rows represent the categories of one categorical
variable (males and females for gender) and the columns represent the
categories of the other categorical variable (white paint and nonwhite paint).
Table 14-1 contains the results from a sample of 1,000 people (500 men and
500 women).
Table 14-1 Gender and House Paint Color Preference:
Observed Cell Counts
White Paint Nonwhite Paint Marginal Row
Totals
Men 180 320 500
Women 125 375 500
Marginal 305 695 1,000
Column Totals (Grand Total)
21_466469-ch14.indd 243 7/24/09 9:51:29 AM