
Page 254 - Statistics II for Dummies
P. 254
238 Part IV: Building Strong Connections with Chi-Square Tests
One of the variables that wasn’t considered when I made Table 13-5 was the
difficulty level of the video game being played. Suppose I go back and include
the difficulty level of the chosen game each time, along with each result (won
or lost). Level one indicates easy video games, comparable to the level of Ms.
Pac Man (games that are my speed), and level two means more challenging
video games (like war games or sophisticated strategy games).
Table 13-6 represents the results with the addition of this new information on
difficulty level of games played. You have three variables now: level of diffi-
culty (one or two), gender (male or female), and outcome (won or lost). That
makes Table 13-6 a three-way table.
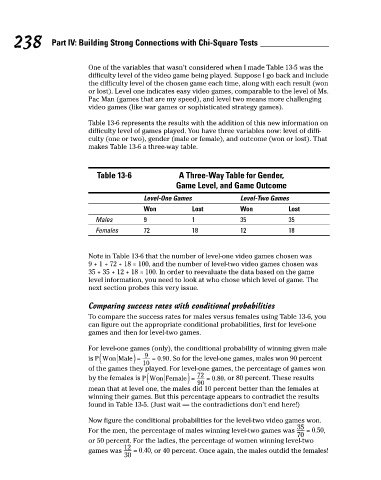
Table 13-6 A Three-Way Table for Gender,
Game Level, and Game Outcome
Level-One Games Level-Two Games
Won Lost Won Lost
Males 9 1 35 35
Females 72 18 12 18
Note in Table 13-6 that the number of level-one video games chosen was
9 + 1 + 72 + 18 = 100, and the number of level-two video games chosen was
35 + 35 + 12 + 18 = 100. In order to reevaluate the data based on the game
level information, you need to look at who chose which level of game. The
next section probes this very issue.
Comparing success rates with conditional probabilities
To compare the success rates for males versus females using Table 13-6, you
can figure out the appropriate conditional probabilities, first for level-one
games and then for level-two games.
For level-one games (only), the conditional probability of winning given male
is . So for the level-one games, males won 90 percent
of the games they played. For level-one games, the percentage of games won
by the females is , or 80 percent. These results
mean that at level one, the males did 10 percent better than the females at
winning their games. But this percentage appears to contradict the results
found in Table 13-5. (Just wait — the contradictions don’t end here!)
Now figure the conditional probabilities for the level-two video games won.
For the men, the percentage of males winning level-two games was ,
or 50 percent. For the ladies, the percentage of women winning level-two
games was , or 40 percent. Once again, the males outdid the females!
20_466469-ch13.indd 238 7/24/09 9:48:01 AM