
Page 265 - Statistics II for Dummies
P. 265
Chapter 14: Being Independent Enough for the Chi-Square Test 249
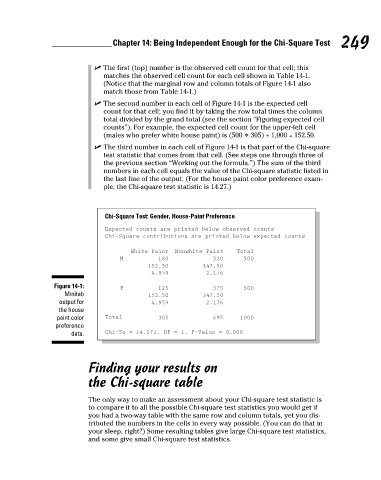
✓ The first (top) number is the observed cell count for that cell; this
matches the observed cell count for each cell shown in Table 14-1.
(Notice that the marginal row and column totals of Figure 14-1 also
match those from Table 14-1.)
✓ The second number in each cell of Figure 14-1 is the expected cell
count for that cell; you find it by taking the row total times the column
total divided by the grand total (see the section “Figuring expected cell
counts”). For example, the expected cell count for the upper-left cell
(males who prefer white house paint) is (500 * 305) ÷ 1,000 = 152.50.
✓ The third number in each cell of Figure 14-1 is that part of the Chi-square
test statistic that comes from that cell. (See steps one through three of
the previous section “Working out the formula.”) The sum of the third
numbers in each cell equals the value of the Chi-square statistic listed in
the last line of the output. (For the house paint color preference exam-
ple, the Chi-square test statistic is 14.27.)
Chi-Square Test: Gender, House-Paint Preference
Expected counts are printed below observed counts
Chi-Square contributions are printed below expected counts
White Paint Nonwhite Paint Total
M 180 320 500
152.50 347.50
4.959 2.176
Figure 14-1: F 125 375 500
Minitab 152.50 347.50
output for 4.959 2.176
the house
paint color Total 305 695 1000
preference
data. Chi-Sq = 14.271, DF = 1, P-Value = 0.000
Finding your results on
the Chi-square table
The only way to make an assessment about your Chi-square test statistic is
to compare it to all the possible Chi-square test statistics you would get if
you had a two-way table with the same row and column totals, yet you dis-
tributed the numbers in the cells in every way possible. (You can do that in
your sleep, right?) Some resulting tables give large Chi-square test statistics,
and some give small Chi-square test statistics.
21_466469-ch14.indd 249 7/24/09 9:51:30 AM