
Page 41 - Statistics II for Dummies
P. 41
Chapter 2: Finding the Right Analysis for the Job 25
Looking for relationships between
categorical variables
Suppose you want to know whether two categorical variables are related; for
example, is gender related to political affiliation? Answering this question
requires putting the sample data into a two-way table (using rows and col-
umns to represent the two variables) and analyzing the data by using a Chi-
square test (see Chapter 14).
By following this process, you can determine if two categorical variables are
independent (unrelated) or if a relationship exists between them. If you find a
relationship, you can use percentages to describe it.
Table 2-1 shows an example of data organized in a two-way table. The data
was collected by the Pew Research Foundation.
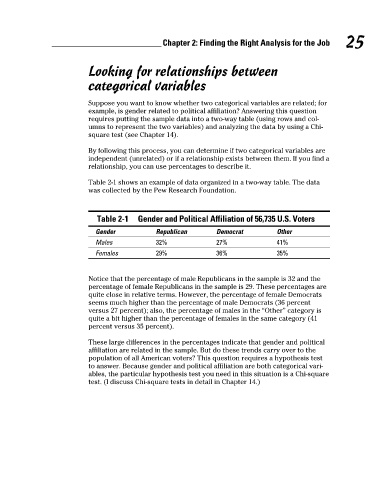
Table 2-1 Gender and Political Affiliation of 56,735 U.S. Voters
Gender Republican Democrat Other
Males 32% 27% 41%
Females 29% 36% 35%
Notice that the percentage of male Republicans in the sample is 32 and the
percentage of female Republicans in the sample is 29. These percentages are
quite close in relative terms. However, the percentage of female Democrats
seems much higher than the percentage of male Democrats (36 percent
versus 27 percent); also, the percentage of males in the “Other” category is
quite a bit higher than the percentage of females in the same category (41
percent versus 35 percent).
These large differences in the percentages indicate that gender and political
affiliation are related in the sample. But do these trends carry over to the
population of all American voters? This question requires a hypothesis test
to answer. Because gender and political affiliation are both categorical vari-
ables, the particular hypothesis test you need in this situation is a Chi-square
test. (I discuss Chi-square tests in detail in Chapter 14.)
06_466469-ch02.indd 25 7/24/09 9:31:37 AM