
Page 66 - Statistics II for Dummies
P. 66
50
Part I: Tackling Data Analysis and Model-Building Basics
Controlling the sample size
How can you increase the power of your hypothesis test? You don’t have any
control over the actual value of the parameter, because that number is unknown.
So what do you have control over? The sample size. As the sample size
increases, it becomes easier to detect a real difference from Ho.
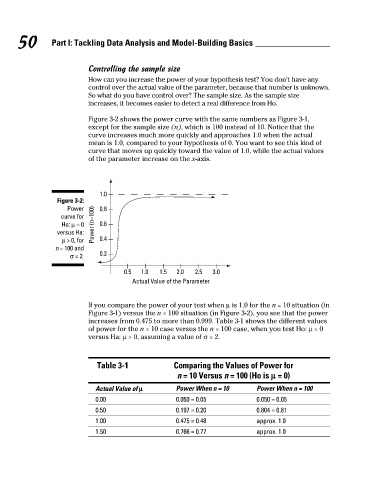
Figure 3-2 shows the power curve with the same numbers as Figure 3-1,
except for the sample size (n), which is 100 instead of 10. Notice that the
curve increases much more quickly and approaches 1.0 when the actual
mean is 1.0, compared to your hypothesis of 0. You want to see this kind of
curve that moves up quickly toward the value of 1.0, while the actual values
of the parameter increase on the x-axis.
1.0
Figure 3-2:
Power 0.8
curve for
Ho: µ = 0 Power (n=100) 0.6
versus Ha:
µ > 0, for 0.4
n = 100 and
0.2
σ = 2.
0.5 1.0 1.5 2.0 2.5 3.0
Actual Value of the Parameter
If you compare the power of your test when µ is 1.0 for the n = 10 situation (in
Figure 3-1) versus the n = 100 situation (in Figure 3-2), you see that the power
increases from 0.475 to more than 0.999. Table 3-1 shows the different values
of power for the n = 10 case versus the n = 100 case, when you test Ho: µ = 0
versus Ha: µ > 0, assuming a value of σ = 2.
Table 3-1 Comparing the Values of Power for
n = 10 Versus n = 100 (Ho is µ = 0)
Actual Value of µ Power When n = 10 Power When n = 100
0.00 0.050 = 0.05 0.050 = 0.05
0.50 0.197 = 0.20 0.804 = 0.81
1.00 0.475 = 0.48 approx. 1.0
1.50 0.766 = 0.77 approx. 1.0
7/23/09 9:23:27 PM
07_466469-ch03.indd 50
07_466469-ch03.indd 50 7/23/09 9:23:27 PM