
Page 67 - Statistics II for Dummies
P. 67
Chapter 3: Reviewing Confidence Intervals and Hypothesis Tests
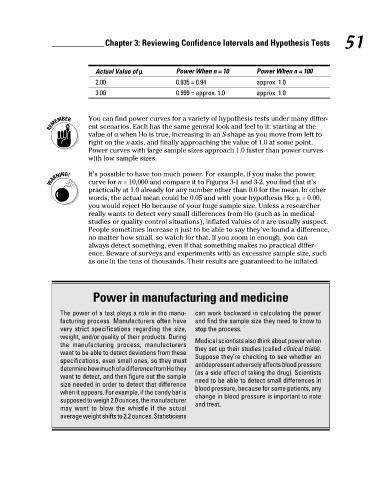
Actual Value of µ Power When n = 10 Power When n = 100 51
2.00 0.935 = 0.94 approx. 1.0
3.00 0.999 = approx. 1.0 approx. 1.0
You can find power curves for a variety of hypothesis tests under many differ-
ent scenarios. Each has the same general look and feel to it: starting at the
value of α when Ho is true, increasing in an S-shape as you move from left to
right on the x-axis, and finally approaching the value of 1.0 at some point.
Power curves with large sample sizes approach 1.0 faster than power curves
with low sample sizes.
It’s possible to have too much power. For example, if you make the power
curve for n = 10,000 and compare it to Figures 3-1 and 3-2, you find that it’s
practically at 1.0 already for any number other than 0.0 for the mean. In other
words, the actual mean could be 0.05 and with your hypothesis Ho: µ = 0.00,
you would reject Ho because of your huge sample size. Unless a researcher
really wants to detect very small differences from Ho (such as in medical
studies or quality control situations), inflated values of n are usually suspect.
People sometimes increase n just to be able to say they’ve found a difference,
no matter how small, so watch for that. If you zoom in enough, you can
always detect something, even if that something makes no practical differ-
ence. Beware of surveys and experiments with an excessive sample size, such
as one in the tens of thousands. Their results are guaranteed to be inflated.
Power in manufacturing and medicine
The power of a test plays a role in the manu- can work backward in calculating the power
facturing process. Manufacturers often have and find the sample size they need to know to
very strict specifications regarding the size, stop the process.
weight, and/or quality of their products. During
the manufacturing process, manufacturers Medical scientists also think about power when
want to be able to detect deviations from these they set up their studies (called clinical trials).
specifications, even small ones, so they must Suppose they’re checking to see whether an
determine how much of a difference from Ho they antidepressant adversely affects blood pressure
want to detect, and then figure out the sample (as a side effect of taking the drug). Scientists
size needed in order to detect that difference need to be able to detect small differences in
when it appears. For example, if the candy bar is blood pressure, because for some patients, any
supposed to weigh 2.0 ounces, the manufacturer change in blood pressure is important to note
may want to blow the whistle if the actual and treat.
average weight shifts to 2.2 ounces. Statisticians
7/23/09 9:23:27 PM
07_466469-ch03.indd 51 7/23/09 9:23:27 PM
07_466469-ch03.indd 51