
Page 94 - Statistics II for Dummies
P. 94
78 Part II: Using Different Types of Regression to Make Predictions
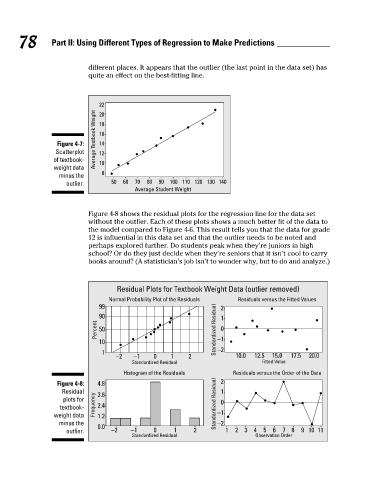
different places. It appears that the outlier (the last point in the data set) has
quite an effect on the best-fitting line.
22
Average Textbook Weight 18
20
16
Figure 4-7: 14
Scatterplot 12
of textbook- 10
weight data
minus the 8
outlier. 50 60 70 80 90 100 110 120 130 140
Average Student Weight
Figure 4-8 shows the residual plots for the regression line for the data set
without the outlier. Each of these plots shows a much better fit of the data to
the model compared to Figure 4-6. This result tells you that the data for grade
12 is influential in this data set and that the outlier needs to be noted and
perhaps explored further. Do students peak when they’re juniors in high
school? Or do they just decide when they’re seniors that it isn’t cool to carry
books around? (A statistician’s job isn’t to wonder why, but to do and analyze.)
Residual Plots for Textbook Weight Data (outlier removed)
Normal Probability Plot of the Residuals Residuals versus the Fitted Values
99 2
90 1
Percent 50 Standardized Residual 0
10 −1
1 −2
−2 −1 0 1 2 10.0 12.5 15.0 17.5 20.0
Standardized Residual Fitted Value
Histogram of the Residuals Residuals versus the Order of the Data
Figure 4-8: 4.8 2
Residual 3.6 1
plots for 0
textbook- Frequency 2.4 Standardized Residual
weight data 1.2 −1
minus the −2
0.0
outlier. −2 −1 0 1 2 1 2 3 4 5 6 7 8 9 10 11
Standardized Residual Observation Order
09_466469-ch04.indd 78 7/24/09 10:20:40 AM