
Page 90 - Statistics II for Dummies
P. 90
74 Part II: Using Different Types of Regression to Make Predictions
In general, a positive residual means you underestimated y at that point; the
line is below the data. A negative residual means you overestimated y at that
point; the line is above the data.
Standardizing the residuals
Residuals in their raw form are in the same units as the original data, making
them hard to judge out of context. To make interpreting the residuals easier,
statisticians typically standardize them — that is, subtract the mean of the
residuals (zero) and divide by the standard deviation of all the residuals. The
residuals are a data set just like any other data set, so you can find their mean
and standard deviation like you always do. Standardizing just means convert-
ing to a Z-score so that you see where it falls on the standard normal distribu-
tion. (See your Stats I text or Statistics For Dummies for info on Z-scores.)
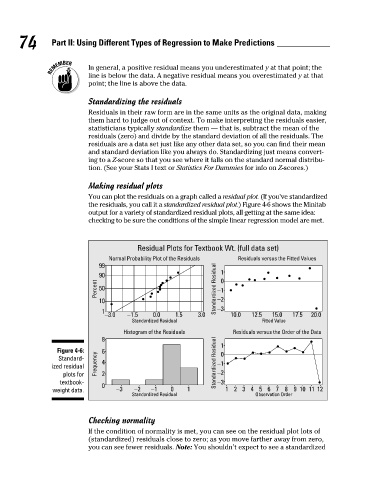
Making residual plots
You can plot the residuals on a graph called a residual plot. (If you’ve standardized
the residuals, you call it a standardized residual plot.) Figure 4-6 shows the Minitab
output for a variety of standardized residual plots, all getting at the same idea:
checking to be sure the conditions of the simple linear regression model are met.
Residual Plots for Textbook Wt. (full data set)
Normal Probability Plot of the Residuals Residuals versus the Fitted Values
99
90 1 0
Percent 50 Standardized Residual −1
10 −2
1 −3
−3.0 −1.5 0.0 1.5 3.0 10.0 12.5 15.0 17.5 20.0
Standardized Residual Fitted Value
Histogram of the Residuals Residuals versus the Order of the Data
8
Figure 4-6: 6 1
Standard- 0
ized residual Frequency 4 Standardized Residual −1
plots for 2 −2
textbook- −3
0
weight data. −3 −2 −1 0 1 1 2 3 4 5 6 7 8 9 10 11 12
Standardized Residual Observation Order
Checking normality
If the condition of normality is met, you can see on the residual plot lots of
(standardized) residuals close to zero; as you move farther away from zero,
you can see fewer residuals. Note: You shouldn’t expect to see a standardized
09_466469-ch04.indd 74 7/24/09 10:20:39 AM