
Page 86 - Statistics II for Dummies
P. 86
70 Part II: Using Different Types of Regression to Make Predictions
To find a 1 – α level prediction interval for the value of y for a given x* using
Minitab, you ask for a regression analysis (see instructions in the earlier
section “Finding the best-fitting line to model your data”) and click Options. In
the box Prediction Intervals for New Observations, enter the value of x that
you want, and just below that, put in your confidence level (the default is 95
percent). On the computer output, the prediction interval is labeled 95% PI,
and it appears right next to the confidence interval for the mean of y for that
same x*.
Predicting textbook weight using student weight
For the textbook-weight data, suppose you’ve already made your regression
line and now a new student comes on the scene. You want to predict this
student’s textbook weight. This means you want a prediction interval rather
than a confidence interval, because you want to predict the textbook weight
for one person, not the average weight for a group.
Suppose this new student weighs 100 pounds. To find the prediction interval
for the textbook weight for this student, you use x* = 100 pounds and let
Minitab do its thing.
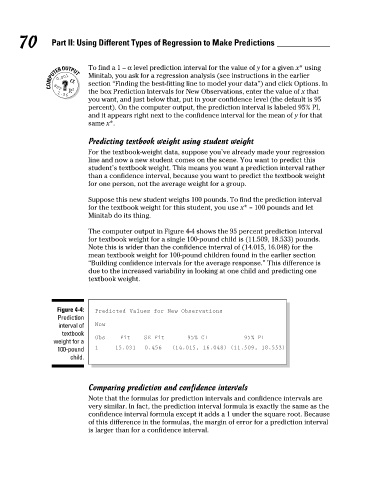
The computer output in Figure 4-4 shows the 95 percent prediction interval
for textbook weight for a single 100-pound child is (11.509, 18.533) pounds.
Note this is wider than the confidence interval of (14.015, 16.048) for the
mean textbook weight for 100-pound children found in the earlier section
“Building confidence intervals for the average response.” This difference is
due to the increased variability in looking at one child and predicting one
textbook weight.
Figure 4-4: Predicted Values for New Observations
Prediction
interval of New
textbook Obs Fit SE Fit 95% CI 95% PI
weight for a
100-pound 1 15.031 0.456 (14.015, 16.048) (11.509, 18.553)
child.
Comparing prediction and confidence intervals
Note that the formulas for prediction intervals and confidence intervals are
very similar. In fact, the prediction interval formula is exactly the same as the
confidence interval formula except it adds a 1 under the square root. Because
of this difference in the formulas, the margin of error for a prediction interval
is larger than for a confidence interval.
09_466469-ch04.indd 70 7/24/09 10:20:39 AM