
Page 88 - Statistics II for Dummies
P. 88
72 Part II: Using Different Types of Regression to Make Predictions
Normal y’s for every x
For any value of x, the population of possible y-values must have a normal
distribution. The mean of this distribution is the value for y that’s on the
best-fitting line for that x-value. That is, some of your data fall above the best-
fitting line, some data fall below the best fitting line, and a few may actually
land right on the line.
If the regression model is fitting well, the data values should be scattered
around the best-fitting line in such a way that about 68 percent of the values
lie within one standard deviation of the line, about 95 percent of the values lie
within two standard deviations of the line, and about 99.7 percent of the
values lie within three standard deviations of the line. This specification, as
you may recall from your Stats I course, is called the 68-95-99.7 rule, and it
applies to all bell-shaped data (for which the normal distribution applies).
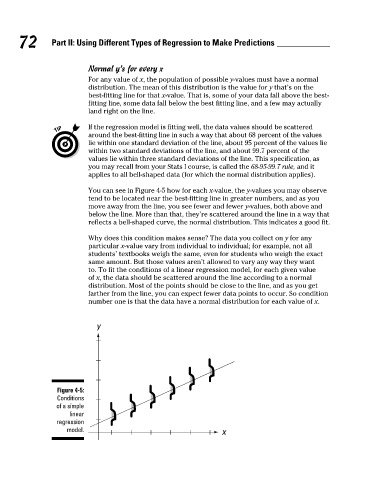
You can see in Figure 4-5 how for each x-value, the y-values you may observe
tend to be located near the best-fitting line in greater numbers, and as you
move away from the line, you see fewer and fewer y-values, both above and
below the line. More than that, they’re scattered around the line in a way that
reflects a bell-shaped curve, the normal distribution. This indicates a good fit.
Why does this condition makes sense? The data you collect on y for any
particular x-value vary from individual to individual; for example, not all
students’ textbooks weigh the same, even for students who weigh the exact
same amount. But those values aren’t allowed to vary any way they want
to. To fit the conditions of a linear regression model, for each given value
of x, the data should be scattered around the line according to a normal
distribution. Most of the points should be close to the line, and as you get
farther from the line, you can expect fewer data points to occur. So condition
number one is that the data have a normal distribution for each value of x.
y
Figure 4-5:
Conditions
of a simple
linear
regression
model. x
09_466469-ch04.indd 72 7/24/09 10:20:39 AM