
Page 89 - Statistics II for Dummies
P. 89
Chapter 4: Getting in Line with Simple Linear Regression 73
Same spread for every x
In order to use the simple linear regression model, as you move from left to
right on the x-axis, the spread in the y-values around the line should be the
same, no matter which value of x you’re looking at. This requirement is called
the homoscedasticity condition. (How they came up with that mouthful of a word
just for describing the fact that the standard deviations stay the same across
the x-values, I’ll never know.) This condition ensures that the best-fitting line
works well for all relevant values of x, not just in certain areas.
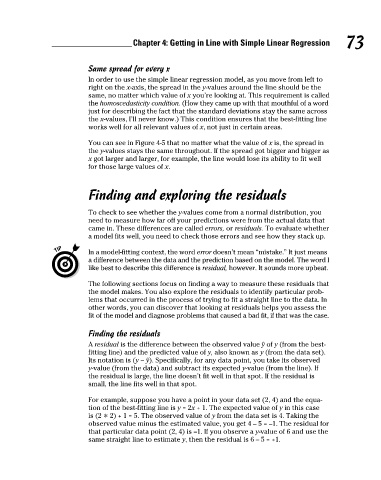
You can see in Figure 4-5 that no matter what the value of x is, the spread in
the y-values stays the same throughout. If the spread got bigger and bigger as
x got larger and larger, for example, the line would lose its ability to fit well
for those large values of x.
Finding and exploring the residuals
To check to see whether the y-values come from a normal distribution, you
need to measure how far off your predictions were from the actual data that
came in. These differences are called errors, or residuals. To evaluate whether
a model fits well, you need to check those errors and see how they stack up.
In a model-fitting context, the word error doesn’t mean “mistake.” It just means
a difference between the data and the prediction based on the model. The word I
like best to describe this difference is residual, however. It sounds more upbeat.
The following sections focus on finding a way to measure these residuals that
the model makes. You also explore the residuals to identify particular prob-
lems that occurred in the process of trying to fit a straight line to the data. In
other words, you can discover that looking at residuals helps you assess the
fit of the model and diagnose problems that caused a bad fit, if that was the case.
Finding the residuals
y
A residual is the difference between the observed value ˆ of y (from the best-
fitting line) and the predicted value of y, also known as y (from the data set).
y
Its notation is (y – ˆ). Specifically, for any data point, you take its observed
y-value (from the data) and subtract its expected y-value (from the line). If
the residual is large, the line doesn’t fit well in that spot. If the residual is
small, the line fits well in that spot.
For example, suppose you have a point in your data set (2, 4) and the equa-
tion of the best-fitting line is y = 2x + 1. The expected value of y in this case
is (2 * 2) + 1 = 5. The observed value of y from the data set is 4. Taking the
observed value minus the estimated value, you get 4 – 5 = –1. The residual for
that particular data point (2, 4) is –1. If you observe a y-value of 6 and use the
same straight line to estimate y, then the residual is 6 – 5 = +1.
09_466469-ch04.indd 73 7/24/09 10:20:39 AM