
Page 161 - Statistics and Data Analysis in Geology
P. 161
Statistics and Data Analysis in Geology - Chapter 6
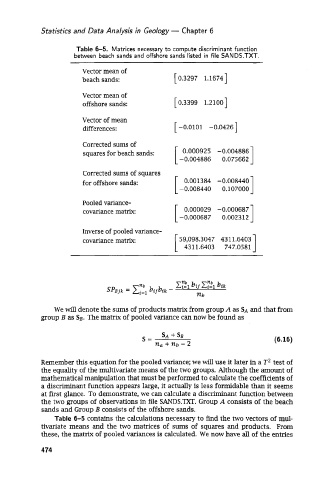
Table 6-5. Matrices necessary to compute discriminant function
between beach sands and ofFshore sands listed in file SANDS-TXT.
Vector mean of
beach sands: [ 0.3297 1.16741
Vector mean of
offshore sands: [ 0.3399 1.21001
Vector of mean
differences: [ -0.0101 -0.04261
Corrected sums of
squares for beach sands: 0.000925 -0.004886
-0.004886 0.075662
Corrected sums of squares
for offshore sands: 0.001384 -0.008440
-0.008440 0.107000
Pooled variance-
covariance matrix: 0.000029 -0.000687 1
-0.000687 0.002312
Inverse of pooled variance-
covariance matrix: 59,098.3047 4311.6403 1
4311.6403 747.0581
We will denote the sums of products matrix from group A as SA and that from
group B as SB. The matrix of pooled variance can now be found as
S= SA f SB (6.16)
n, + nb - 2
Remember this equation for the pooled variance: we will use it later in a T2 test of
the equality of the multivariate means of the two groups. Although the amount of
mathematical manipulation that must be performed to calculate the coefficients of
a discriminant function appears large, it actually is less formidable than it seems
at first glance. To demonstrate, we can calculate a discriminant function between
the two groups of observations in file SANDS.TXT. Group A consists of the beach
sands and Group B consists of the offshore sands.
Table 6-5 contains the calculations necessary to find the two vectors of mul-
tivariate means and the two matrices of sums of squares and products. From
these, the matrix of pooled variances is calculated. We now have all of the entries
474