
Page 159 - Statistics and Data Analysis in Geology
P. 159
Statistics and Data Analysis in Geology- Chapter 6
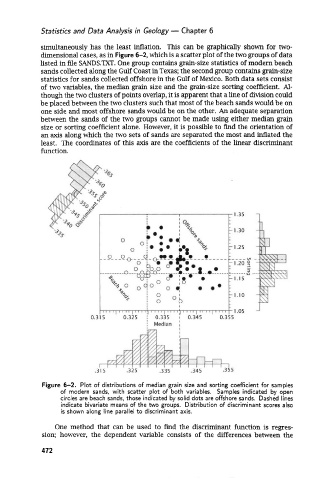
simultaneously has the least inflation. This can be graphically shown for two-
dimensional cases, as in Figure 6-2, which is a scatter plot of the two groups of data
listed in file SANDS.TXT. One group contains grain-size statistics of modern beach
sands collected along the Gulf Coast in Texas; the second group contains grain-size
statistics for sands collected offshore in the Gulf of Mexico. Both data sets consist
of two variables, the median grain size and the grain-size sorting coefficient. Al-
though the two clusters of points overlap, it is apparent that a line of division could
be placed between the two clusters such that most of the beach sands would be on
one side and most offshore sands would be on the other. An adequate separation
between the sands of the two groups cannot be made using either median grain
size or sorting coefficient alone. However, it is possible to find the orientation of
an axis along which the two sets of sands are separated the most and inflated the
least. The coordinates of this axis are the coefficients of the linear discriminant
function.
Figure 6-2. Plot of distributions of median grain size and sorting coefFicient for samples
of modern sands, with scatter plot of both variables. Samples indicated by open
circles are beach sands, those indicated by solid dots are ofkhore sands. Dashed lines
indicate bivariate means of the two groups. Distribution of discriminant scores also
is shown along line parallel to discriminant axis.
One method that can be used to find the discriminant function is regres-
sion; however, the dependent variable consists of the differences between the
472