Page 124 - Statistics for Dummies
P. 124

108
                                         Part II: Number-Crunching Basics
                                                         20
                                                       Percentage of people in each group
                                                         15
                                                         10
                                                          5
                                                          0
                                                                            2.5
                                                                  1.5 Time Spent Filling Out a Survey (n = 50)  5.5
                                                                                       3.5
                                                                                                 4.5
                                                                                   Time (minutes)
                                                    a
                                                                       Student Exam Scores (n = 17)
                                                          4
                                                        Number of students in each group  3 2
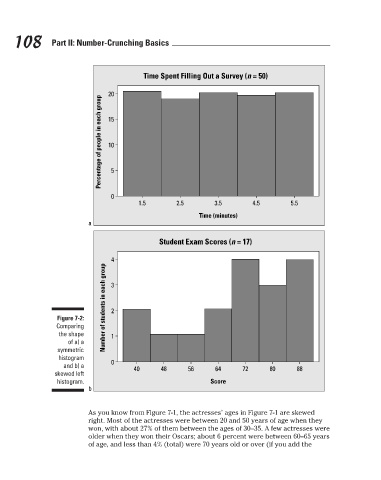
                                           Figure 7-2:
                                           Comparing
                                           the shape      1
                                              of a) a
                                           symmetric
                                           histogram
                                                          0
                                             and b) a
                                                                40      48     56      64      72     80      88
                                          skewed left
                                           histogram.                                 Score
                                                     b

                                                    As you know from Figure 7-1, the actresses’ ages in Figure 7-1 are skewed
                                                    right. Most of the actresses were between 20 and 50 years of age when they
                                                    won, with about 27% of them between the ages of 30–35. A few actresses were
                                                    older when they won their Oscars; about 6 percent were between 60–65 years
                                                    of age, and less than 4% (total) were 70 years old or over (if you add the


                                                                                                                           3/25/11   8:16 PM
                             12_9780470911082-ch07.indd   108                                                              3/25/11   8:16 PM
                             12_9780470911082-ch07.indd   108
   119   120   121   122   123   124   125   126   127   128   129