
Page 163 - Statistics for Dummies
P. 163
Chapter 9: The Normal Distribution
Z
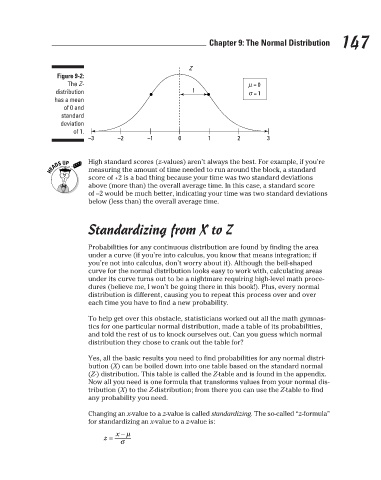
Figure 9-2:
The Z-
1
σ
distribution
= 1
has a mean
of 0 and
standard
deviation
of 1.
–2
–1
0
–3
1
High standard scores (z-values) aren’t always the best. For example, if you’re
measuring the amount of time needed to run around the block, a standard
score of +2 is a bad thing because your time was two standard deviations
above (more than) the overall average time. In this case, a standard score
of –2 would be much better, indicating your time was two standard deviations
below (less than) the overall average time. 2 μ = 0 3 147
Standardizing from X to Z
Probabilities for any continuous distribution are found by finding the area
under a curve (if you’re into calculus, you know that means integration; if
you’re not into calculus, don’t worry about it). Although the bell-shaped
curve for the normal distribution looks easy to work with, calculating areas
under its curve turns out to be a nightmare requiring high-level math proce-
dures (believe me, I won’t be going there in this book!). Plus, every normal
distribution is different, causing you to repeat this process over and over
each time you have to find a new probability.
To help get over this obstacle, statisticians worked out all the math gymnas-
tics for one particular normal distribution, made a table of its probabilities,
and told the rest of us to knock ourselves out. Can you guess which normal
distribution they chose to crank out the table for?
Yes, all the basic results you need to find probabilities for any normal distri-
bution (X) can be boiled down into one table based on the standard normal
(Z-) distribution. This table is called the Z-table and is found in the appendix.
Now all you need is one formula that transforms values from your normal dis-
tribution (X) to the Z-distribution; from there you can use the Z-table to find
any probability you need.
Changing an x-value to a z-value is called standardizing. The so-called “z-formula”
for standardizing an x-value to a z-value is:
3/25/11 8:16 PM
15_9780470911082-ch09.indd 147 3/25/11 8:16 PM
15_9780470911082-ch09.indd 147