Page 166 - Statistics for Dummies
P. 166

150
                                         Part III: Distributions and the Central Limit Theorem

                                                    The probability that X is equal to any single value is 0 for any continuous
                                                    random variable (like the normal). That’s because continuous random vari-
                                                    ables consider probability as being area under the curve, and there’s no area
                                                    under a curve at one single point. This isn’t true of discrete random variables.
                                                    Suppose, for example, that you enter a fishing contest. The contest takes
                                                    place in a pond where the fish lengths have a normal distribution with mean
                                                    μ = 16 inches and standard deviation σ = 4 inches.
                                                     ✓ Problem 1: What’s the chance of catching a small fish — say, less than
                                                        8 inches?
                                                     ✓ Problem 2: Suppose a prize is offered for any fish over 24 inches. What’s
                                                        the chance of winning a prize?
                                                     ✓ Problem 3: What’s the chance of catching a fish between 16 and
                                                        24 inches?
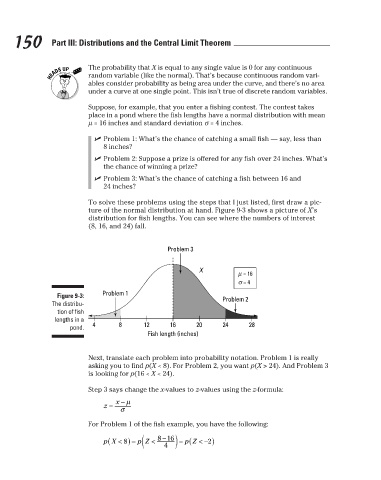
                                                    To solve these problems using the steps that I just listed, first draw a pic-
                                                    ture of the normal distribution at hand. Figure 9-3 shows a picture of X’s
                                                    distribution for fish lengths. You can see where the numbers of interest
                                                    (8, 16, and 24) fall.
                                                                          Problem 3
                                                                                   X
                                                                                             μ  = 16
                                                                                             σ  = 4
                                                        Problem 1
                                           Figure 9-3:
                                                                                         Problem 2
                                          The distribu-
                                           tion of fish
                                          lengths in a
                                                     4      8      12     16      20     24     28
                                               pond.
                                                                    Fish length (inches)
                                                    Next, translate each problem into probability notation. Problem 1 is really
                                                    asking you to find p(X < 8). For Problem 2, you want p(X > 24). And Problem 3
                                                    is looking for p(16 < X < 24).
                                                    Step 3 says change the x-values to z-values using the z-formula:
                                                    For Problem 1 of the fish example, you have the following:


                                                                                                                           3/25/11   8:16 PM
                             15_9780470911082-ch09.indd   150                                                              3/25/11   8:16 PM
                             15_9780470911082-ch09.indd   150
   161   162   163   164   165   166   167   168   169   170   171