Page 169 - Statistics for Dummies
P. 169

Chapter 9: The Normal Distribution

                                                      2. Find the corresponding percentile for Z by looking in the body of the
                                                        Z-table (in the appendix) and finding the probability that is closest
                                                        to p (from Step 1a) or 1 – p (from Step 1b). Find the row and column
                                                        this probability is in (using the table backwards). This is the desired
                                                        z-value.
                                                      3. Change the z-value back into an x-value (original units) by using

                                                                 . You’ve (finally!) found the desired percentile for X.
                                                         The formula in this step is just a rewriting of the z-formula,

                                                        it’s solved for x.
                                                    Doing a low percentile problem
                                                    Look at the fish example used previously in “Finding Probabilities for a
                                                    Normal Distribution,” where the lengths (X) of fish in a pond have a normal
                                                    distribution with mean 16 inches and standard deviation 4 inches. Suppose
                                                    you want to know what length marks the bottom 10 percent of all the fish
                                                    lengths in the pond. What percentile are you looking for?      , so   153
                                                    Being at the bottom 10 percent means you have a “less-than” probability that’s
                                                    equal to 10 percent, and you are at the 10th percentile.
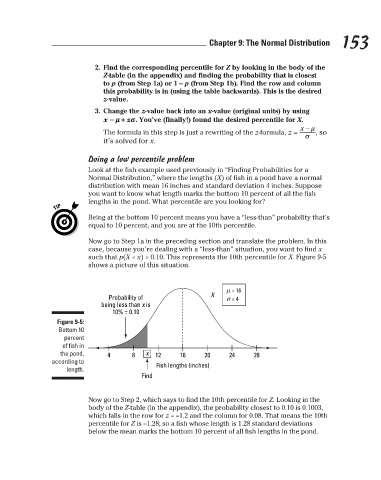
                                                    Now go to Step 1a in the preceding section and translate the problem. In this
                                                    case, because you’re dealing with a “less-than” situation, you want to find x
                                                    such that p(X < x) = 0.10. This represents the 10th percentile for X. Figure 9-5
                                                    shows a picture of this situation.
                                                                                          μ  = 16
                                                                                      X
                                                         Probability of                   σ  = 4
                                                       being less than x is
                                                          10% = 0.10
                                           Figure 9-5:
                                           Bottom 10
                                             percent
                                             of fish in
                                            the pond,    4      8   x  12    16     20     24     28
                                          according to                 Fish lengths (inches)
                                              length.
                                                                   Find
                                                    Now go to Step 2, which says to find the 10th percentile for Z. Looking in the
                                                    body of the Z-table (in the appendix), the probability closest to 0.10 is 0.1003,
                                                    which falls in the row for z = –1.2 and the column for 0.08. That means the 10th
                                                    percentile for Z is –1.28; so a fish whose length is 1.28 standard deviations
                                                    below the mean marks the bottom 10 percent of all fish lengths in the pond.


                                                                                                                           3/25/11   8:16 PM
                             15_9780470911082-ch09.indd   153
                             15_9780470911082-ch09.indd   153                                                              3/25/11   8:16 PM
   164   165   166   167   168   169   170   171   172   173   174