Page 174 - Statistics for Dummies
P. 174

158
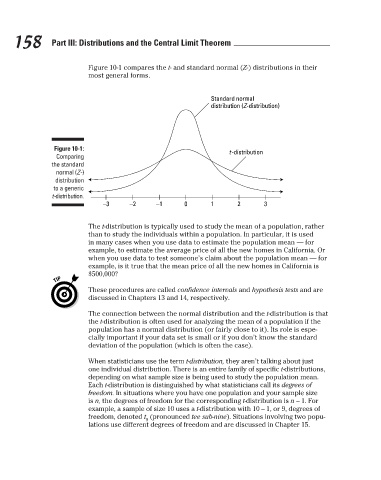
                                                    Figure 10-1 compares the t- and standard normal (Z-) distributions in their
                                                    most general forms.
                                                                                      Standard normal
                                                                                      distribution (Z-distribution)
                                          Figure 10-1:
                                                                                           t-distribution
                                           Comparing
                                          the standard
                                           normal (Z-)
                                           distribution
                                          to a generic
                                          t-distribution.
                                                                              0
                                           Part III: Distributions and the Central Limit Theorem   2  3
                                                        −3
                                                               −2

                                                                       −1
                                                                                      1
                                                    The t-distribution is typically used to study the mean of a population, rather
                                                    than to study the individuals within a population. In particular, it is used
                                                    in many cases when you use data to estimate the population mean — for
                                                    example, to estimate the average price of all the new homes in California. Or
                                                    when you use data to test someone’s claim about the population mean — for
                                                    example, is it true that the mean price of all the new homes in California is
                                                    $500,000?
                                                    These procedures are called confidence intervals and hypothesis tests and are
                                                    discussed in Chapters 13 and 14, respectively.
                                                    The connection between the normal distribution and the t-distribution is that
                                                    the t-distribution is often used for analyzing the mean of a population if the
                                                    population has a normal distribution (or fairly close to it). Its role is espe-
                                                    cially important if your data set is small or if you don’t know the standard
                                                    deviation of the population (which is often the case).
                                                    When statisticians use the term t-distribution, they aren’t talking about just
                                                    one individual distribution. There is an entire family of specific t-distributions,
                                                    depending on what sample size is being used to study the population mean.
                                                    Each t-distribution is distinguished by what statisticians call its degrees of
                                                    freedom. In situations where you have one population and your sample size
                                                    is n, the degrees of freedom for the corresponding t-distribution is n – 1. For
                                                    example, a sample of size 10 uses a t-distribution with 10 – 1, or 9, degrees of
                                                    freedom, denoted t  (pronounced tee sub-nine). Situations involving two popu-
                                                                    9
                                                    lations use different degrees of freedom and are discussed in Chapter 15.


                                                                                                                           3/25/11   8:15 PM
                             16_9780470911082-ch10.indd   158                                                              3/25/11   8:15 PM
                             16_9780470911082-ch10.indd   158
   169   170   171   172   173   174   175   176   177   178   179