
Page 175 - Statistics for Dummies
P. 175
Chapter 10: The t-Distribution
Discovering the effect of variability
on t-distributions
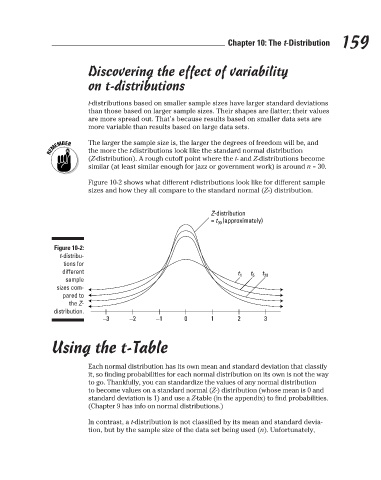
t-distributions based on smaller sample sizes have larger standard deviations
than those based on larger sample sizes. Their shapes are flatter; their values
are more spread out. That’s because results based on smaller data sets are
more variable than results based on large data sets.
The larger the sample size is, the larger the degrees of freedom will be, and
the more the t-distributions look like the standard normal distribution
(Z-distribution). A rough cutoff point where the t- and Z-distributions become
similar (at least similar enough for jazz or government work) is around n = 30.
Figure 10-2 shows what different t-distributions look like for different sample
sizes and how they all compare to the standard normal (Z-) distribution.
Z-distribution 159
= t (approximately)
30
Figure 10-2:
t-distribu-
tions for
different t t
t 1 5 20
sample
sizes com-
pared to
the Z-
distribution.
−3 −2 −1 0 1 2 3
Using the t-Table
Each normal distribution has its own mean and standard deviation that classify
it, so finding probabilities for each normal distribution on its own is not the way
to go. Thankfully, you can standardize the values of any normal distribution
to become values on a standard normal (Z-) distribution (whose mean is 0 and
standard deviation is 1) and use a Z-table (in the appendix) to find probabilities.
(Chapter 9 has info on normal distributions.)
In contrast, a t-distribution is not classified by its mean and standard devia-
tion, but by the sample size of the data set being used (n). Unfortunately,
3/25/11 8:15 PM
16_9780470911082-ch10.indd 159
16_9780470911082-ch10.indd 159 3/25/11 8:15 PM