
Page 192 - Statistics for Dummies
P. 192
176 Part III: Distributions and the Central Limit Theorem
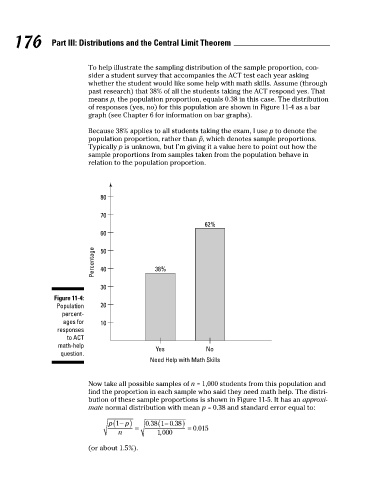
To help illustrate the sampling distribution of the sample proportion, con-
sider a student survey that accompanies the ACT test each year asking
whether the student would like some help with math skills. Assume (through
past research) that 38% of all the students taking the ACT respond yes. That
means p, the population proportion, equals 0.38 in this case. The distribution
of responses (yes, no) for this population are shown in Figure 11-4 as a bar
graph (see Chapter 6 for information on bar graphs).
Because 38% applies to all students taking the exam, I use p to denote the
population proportion, rather than , which denotes sample proportions.
Typically p is unknown, but I’m giving it a value here to point out how the
sample proportions from samples taken from the population behave in
relation to the population proportion.
80
70
62%
60
Percentage 50 38%
40
30
Figure 11-4:
Population 20
percent-
ages for 10
responses
to ACT
math-help Yes No
question.
Need Help with Math Skills
Now take all possible samples of n = 1,000 students from this population and
find the proportion in each sample who said they need math help. The distri-
bution of these sample proportions is shown in Figure 11-5. It has an approxi-
mate normal distribution with mean p = 0.38 and standard error equal to:
(or about 1.5%).
17_9780470911082-ch11.indd 176 3/25/11 10:01 PM