
Page 193 - Statistics for Dummies
P. 193
177
Chapter 11: Sampling Distributions and the Central Limit Theorem
To help illustrate the sampling distribution of the sample proportion, con- The approximate normal distribution works because the two conditions for the
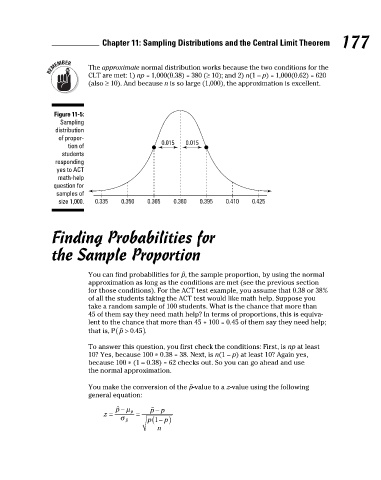
sider a student survey that accompanies the ACT test each year asking CLT are met: 1) np = 1,000(0.38) = 380 (≥ 10); and 2) n(1 – p) = 1,000(0.62) = 620
whether the student would like some help with math skills. Assume (through (also ≥ 10). And because n is so large (1,000), the approximation is excellent.
past research) that 38% of all the students taking the ACT respond yes. That
means p, the population proportion, equals 0.38 in this case. The distribution
of responses (yes, no) for this population are shown in Figure 11-4 as a bar
graph (see Chapter 6 for information on bar graphs). Figure 11-5:
Sampling
Because 38% applies to all students taking the exam, I use p to denote the distribution
population proportion, rather than , which denotes sample proportions. of propor- 0.015 0.015
Typically p is unknown, but I’m giving it a value here to point out how the tion of
sample proportions from samples taken from the population behave in students
relation to the population proportion. responding
yes to ACT
math-help
question for
samples of
size 1,000. 0.335 0.350 0.365 0.380 0.395 0.410 0.425
Finding Probabilities for
the Sample Proportion
You can find probabilities for , the sample proportion, by using the normal
approximation as long as the conditions are met (see the previous section
for those conditions). For the ACT test example, you assume that 0.38 or 38%
of all the students taking the ACT test would like math help. Suppose you
take a random sample of 100 students. What is the chance that more than
45 of them say they need math help? In terms of proportions, this is equiva-
lent to the chance that more than 45 ÷ 100 = 0.45 of them say they need help;
that is, .
To answer this question, you first check the conditions: First, is np at least
10? Yes, because 100 ∗ 0.38 = 38. Next, is n(1 – p) at least 10? Again yes,
because 100 ∗ (1 – 0.38) = 62 checks out. So you can go ahead and use
the normal approximation.
Now take all possible samples of n = 1,000 students from this population and You make the conversion of the -value to a z-value using the following
find the proportion in each sample who said they need math help. The distri- general equation:
bution of these sample proportions is shown in Figure 11-5. It has an approxi-
mate normal distribution with mean p = 0.38 and standard error equal to:
(or about 1.5%).
17_9780470911082-ch11.indd 177 3/25/11 10:01 PM