
Page 189 - Statistics for Dummies
P. 189
173
Chapter 11: Sampling Distributions and the Central Limit Theorem
Say that one person, Bob, is doing 50 rolls. What will the distribution of Bob’s Clarifying three major points about the CLT
outcomes look like? Bob is more likely to get low outcomes (like 1 and 2) and
less likely to get high outcomes (like 5 and 6) — the distribution of Bob’s out- I want to alert you to a few sources of confusion about the Central Limit
comes will be skewed right as well. Theorem before they happen to you:
✓ The CLT is needed only when the distribution of X is not a normal dis-
In fact, because Bob rolled his die a large number of times (50), the distribu-
tion of his individual outcomes has a good chance of matching the distribu- tribution or is unknown. It is not needed if X started out with a normal
tion of X (the outcomes from millions of rolls). However, if Bob had only distribution.
rolled his die a few times (say, 6 times), he would be unlikely to even get ✓ The formulas for the mean and standard error of are not due to
the higher numbers like 5 and 6, and hence his distribution wouldn’t look the CLT. These are just mathematical results that are always true. To
as much like the distribution of X. see these formulas, check out the sections “The Mean of a Sampling
Distribution” and “Measuring Standard Error,” earlier in this chapter.
If you run through the results of each of a million people like Bob who rolled
this unfair die 50 times, each of their million distributions will look very simi- ✓ The n stated in the CLT refers to the size of the sample you take each
lar to each other and very similar to the distribution of X. The more rolls they time, not the number of samples you take. Bob rolling a die 50 times is
make each time, the closer their distributions get to the distribution of X and one sample of size 50, so n = 50. If 10 people do it, you have 10 samples,
to each other. And here is the key: If their distributions of outcomes have a each of size 50, and n is still 50.
similar shape, no matter what that similar shape is, then their averages will
be similar as well. Some people will get higher averages than 2 by chance,
and some will get lower averages by chance, but these types of averages get Finding Probabilities for the Sample Mean
less and less likely the farther you get from 2. This means you’re getting an
approximate normal distribution centered at 2.
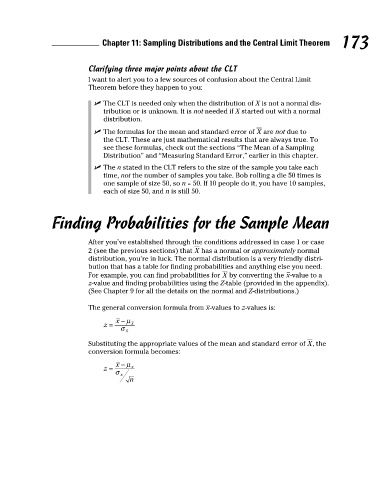
After you’ve established through the conditions addressed in case 1 or case
The big deal is, it doesn’t matter if you started out with a skewed distribu- 2 (see the previous sections) that has a normal or approximately normal
tion, or some totally wacky distribution for X. Because each of them had distribution, you’re in luck. The normal distribution is a very friendly distri-
a large sample size (number of rolls), the distributions of each person’s bution that has a table for finding probabilities and anything else you need.
sample results end up looking similar, so their averages will be similar, close For example, you can find probabilities for by converting the -value to a
together, and close to a normal distribution. In fancy lingo, the distribution z-value and finding probabilities using the Z-table (provided in the appendix).
of is approximately normal as long as n is large enough. This is all due to the (See Chapter 9 for all the details on the normal and Z-distributions.)
Central Limit Theorem.
The general conversion formula from -values to z-values is:
In order for the CLT to work when X does not have a normal distribution, each
person needs to roll their die enough times (that is, n must be large enough)
so they have a good chance of getting all possible values of X, especially those
outcomes that won’t occur as often. If n is too small, some folks will not get
the outcomes that have low probabilities and their means will differ from Substituting the appropriate values of the mean and standard error of , the
the rest by more than they should. As a result, when you put all the means conversion formula becomes:
together, they may not congregate around a single value. In the end, the
approximate normal distribution may not show up.
17_9780470911082-ch11.indd 173 3/25/11 10:01 PM