
Page 185 - Statistics for Dummies
P. 185
169
Chapter 11: Sampling Distributions and the Central Limit Theorem
Why is having more precision around the mean important? Because some-
Pond #1
times you don’t know the mean but want to determine what it is, or at least get Normal, Mean = 20, StDev = 2
as close to it as possible. How can you do that? By taking a large random
sample from the population and finding its mean. You know that your sample
mean will be close to the actual population mean if your sample is large, as
Figure 11-2 shows (assuming your data are collected correctly; see Chapter 16
for details on collecting good data).
Population standard deviation
and standard error
0 10 20 30 40
Fish length (inches)
The second component of standard error involves the amount of diversity a
in the population (measured by standard deviation). In the standard error
Pond #2
formula you see the population standard deviation, , is in the Normal, Mean = 20, StDev = 5
numerator. That means as the population standard deviation increases,
the standard error of the sample means also increases. Mathematically this
makes sense; how about statistically?
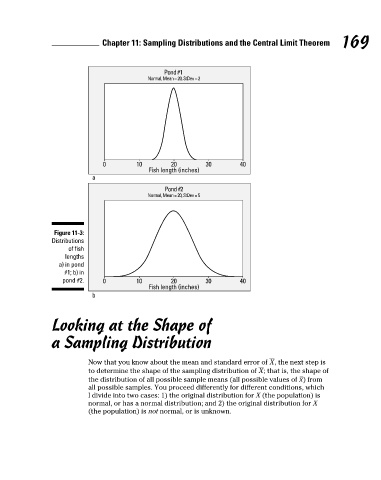
Figure 11-3:
Suppose you have two ponds full of fish (call them pond #1 and pond #2), and
you’re interested in the length of the fish in each pond. Assume the fish lengths Distributions
in each pond have a normal distribution (see Chapter 9). You’ve been told that of fish
the fish lengths in pond #1 have a mean of 20 inches and a standard deviation lengths
of 2 inches (see Figure 11-3a). Suppose the fish in pond #2 also average 20 a) in pond
inches but have a larger standard deviation of 5 inches (see Figure 11-3b). #1; b) in
pond #2. 0 10 20 30 40
Fish length (inches)
Comparing Figures 11-3a and 11-3b, you see the lengths for the two populations b
of fish have the same shape and mean, but the distribution in Figure 11-3b
(for pond #2) has more spread, or variability, than the distribution shown in
Figure 11-3a (for pond #1). This spread confirms that the fish in pond #2 vary
more in length than those in pond #1. Looking at the Shape of
Now suppose you take a random sample of 100 fish from pond #1, find the a Sampling Distribution
mean length of the fish, and repeat this process over and over. Then you do
the same with pond #2. Because the lengths of individual fish in pond #2 have
more variability than the lengths of individual fish in pond #1, you know the Now that you know about the mean and standard error of , the next step is
average lengths of samples from pond #2 will have more variability than the to determine the shape of the sampling distribution of ; that is, the shape of
average lengths of samples from pond #1 as well. (In fact, you can calculate the distribution of all possible sample means (all possible values of ) from
their standard errors using the formula earlier in this section to be 0.20 and all possible samples. You proceed differently for different conditions, which
0.50, respectively.) I divide into two cases: 1) the original distribution for X (the population) is
normal, or has a normal distribution; and 2) the original distribution for X
Estimating the population average is harder when the population varies a lot (the population) is not normal, or is unknown.
to begin with — estimating the population average is much easier when the
population values are more consistent. The bottom line is the standard error
of the sample mean is larger when the population standard deviation is larger.
17_9780470911082-ch11.indd 169 3/25/11 10:01 PM