Page 53 - Statistics for Dummies
P. 53

Chapter 3: Taking Control: So Many Numbers, So Little Time
                                                    Before believing statistics indicating “the highest XXX” or “the lowest XXX,”

                                                    take a look at how the variable is measured to see whether it’s fair and whether
                                                    there are other statistics that should be examined too to get the whole picture.
                                                    Also make sure the units are appropriate for making fair comparisons.
                                                    Zeroing in on what the scale tells you
                                                    Charts and graphs are useful for making a quick and clear point about your
                                                    data. Unfortunately, many times the charts and graphs accompanying everyday
                                                    statistics aren’t done correctly and/or fairly. One of the most important ele-
                                                    ments to watch for is the way that the chart or graph is scaled. The scale of a
                                                    graph is the quantity used to represent each tick mark on the axis of the graph.
                                                    Do the tick marks increase by 1s, 10s, 20s, 100s, 1,000s, or what? The scale can
                                                    make a big difference in terms of the way the graph or chart looks.
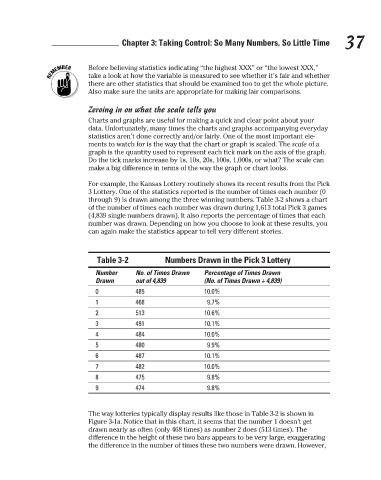
                                                    For example, the Kansas Lottery routinely shows its recent results from the Pick
                                                    3 Lottery. One of the statistics reported is the number of times each number (0
                                                    through 9) is drawn among the three winning numbers. Table 3-2 shows a chart
                                                    of the number of times each number was drawn during 1,613 total Pick 3 games   37
                                                    (4,839 single numbers drawn). It also reports the percentage of times that each
                                                    number was drawn. Depending on how you choose to look at these results, you
                                                    can again make the statistics appear to tell very different stories.
                                                      Table 3-2          Numbers Drawn in the Pick 3 Lottery
                                                      Number     No. of Times Drawn   Percentage of Times Drawn
                                                      Drawn      out of 4,839       (No. of Times Drawn ÷ 4,839)
                                                      0          485                10.0%
                                                      1          468                 9.7%
                                                      2          513                10.6%
                                                      3          491                10.1%
                                                      4          484                10.0%
                                                      5          480                 9.9%
                                                      6          487                10.1%
                                                      7          482                10.0%
                                                      8          475                 9.8%
                                                      9          474                 9.8%
                                                    The way lotteries typically display results like those in Table 3-2 is shown in
                                                    Figure 3-1a. Notice that in this chart, it seems that the number 1 doesn’t get
                                                    drawn nearly as often (only 468 times) as number 2 does (513 times). The
                                                    difference in the height of these two bars appears to be very large, exaggerating
                                                    the difference in the number of times these two numbers were drawn. However,


                                                                                                                           3/25/11   8:17 PM
                             07_9780470911082-ch03.indd   37                                                               3/25/11   8:17 PM
                             07_9780470911082-ch03.indd   37
   48   49   50   51   52   53   54   55   56   57   58