
Page 54 - Statistics for Dummies
P. 54
38
Part I: Vital Statistics about Statistics
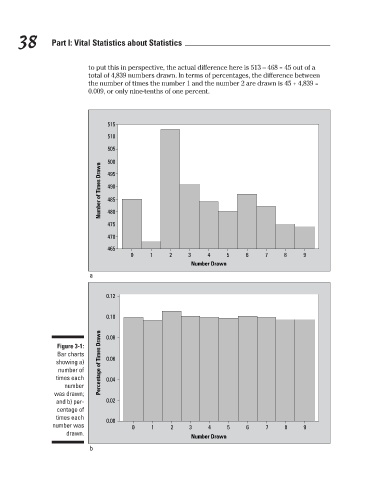
to put this in perspective, the actual difference here is 513 – 468 = 45 out of a
total of 4,839 numbers drawn. In terms of percentages, the difference between
the number of times the number 1 and the number 2 are drawn is 45 ÷ 4,839 =
0.009, or only nine-tenths of one percent.
515
510
505
500
Number of Times Drawn
495
490
485
480
475
470
465
0 1 2 3 4 5 6 7 8 9
Number Drawn
a
0.12
0.10
Figure 3-1: 0.08
Bar charts
showing a) Percentage of Times Drawn 0.06
number of
times each 0.04
number
was drawn;
and b) per- 0.02
centage of
times each
0.00
number was 0 1 2 3 4 5 6 7 8 9
drawn. Number Drawn
b
3/25/11 8:17 PM
07_9780470911082-ch03.indd 38 3/25/11 8:17 PM
07_9780470911082-ch03.indd 38