
Page 97 - Statistics for Environmental Engineers
P. 97
L1592_Frame_C10 Page 91 Tuesday, December 18, 2001 1:46 PM
1.0 Error in y inflated
Particle Volume, V 1.5 Error in y
Error in y
in D
0 suppressed Error
0 0.5 1.0 1.5
Particle Diameter, D
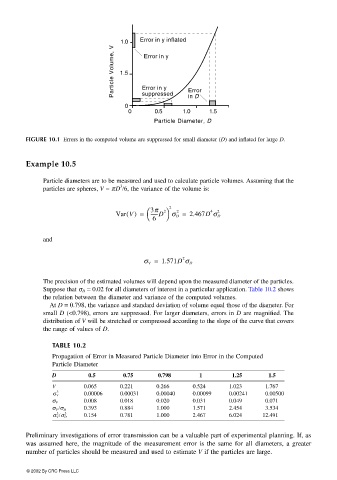
FIGURE 10.1 Errors in the computed volume are suppressed for small diameter (D) and inflated for large D.
Example 10.5
Particle diameters are to be measured and used to calculate particle volumes. Assuming that the
3
particles are spheres, V = πD /6, the variance of the volume is:
Var V() = 3π 2 2 σ D = 2.467D σ D 2
4
2
------D
6
and
σ V = 1.571D σ D
2
The precision of the estimated volumes will depend upon the measured diameter of the particles.
Suppose that σ D = 0.02 for all diameters of interest in a particular application. Table 10.2 shows
the relation between the diameter and variance of the computed volumes.
At D = 0.798, the variance and standard deviation of volume equal those of the diameter. For
small D (<0.798), errors are suppressed. For larger diameters, errors in D are magnified. The
distribution of V will be stretched or compressed according to the slope of the curve that covers
the range of values of D.
TABLE 10.2
Propagation of Error in Measured Particle Diameter into Error in the Computed
Particle Diameter
D 0.5 0.75 0.798 1 1.25 1.5
V 0.065 0.221 0.266 0.524 1.023 1.767
2
σ V 0.00006 0.00031 0.00040 0.00099 0.00241 0.00500
σ V 0.008 0.018 0.020 0.031 0.049 0.071
σ V /σ D 0.393 0.884 1.000 1.571 2.454 3.534
2 2
σ V /σ D 0.154 0.781 1.000 2.467 6.024 12.491
Preliminary investigations of error transmission can be a valuable part of experimental planning. If, as
was assumed here, the magnitude of the measurement error is the same for all diameters, a greater
number of particles should be measured and used to estimate V if the particles are large.
© 2002 By CRC Press LLC