
Page 94 - Statistics for Environmental Engineers
P. 94
L1592_Frame_C10 Page 88 Tuesday, December 18, 2001 1:46 PM
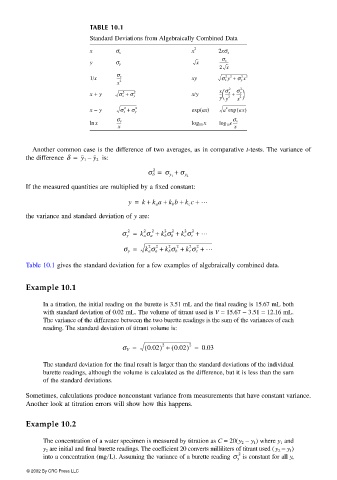
TABLE 10.1
Standard Deviations from Algebraically Combined Data
x σ x x 2 2xσ x
y σ y x ----------
σ x
2 x
2
2
2
1/x σ x xy σ x y + σ y x 2
-----
x 2
2
2
2
x + y σ x + σ y 2 x/y -- ------ + σ y
x σ x
------
2
y y 2 x
2
2
x − y σ x + σ y 2 exp(ax) a exp ( ax)
σ x
ln x σ x log 10 x log e-----
-----
x 10 x
Another common case is the difference of two averages, as in comparative t-tests. The variance of
the difference δ = y 1 – y 2 is:
σ δ = σ y 1 + σ y 2
2
If the measured quantities are multiplied by a fixed constant:
y = k + k a a + k b b + k c c + …
the variance and standard deviation of y are:
σ y = k a σ a + k b σ b + k c σ c + …
2
2
2
2
2
2
2
σ y = k a σ a + k b σ b + k c σ c + …
2
2
2
2
2
2
Table 10.1 gives the standard deviation for a few examples of algebraically combined data.
Example 10.1
In a titration, the initial reading on the burette is 3.51 mL and the final reading is 15.67 mL both
with standard deviation of 0.02 mL. The volume of titrant used is V = 15.67 − 3.51 = 12.16 mL.
The variance of the difference between the two burette readings is the sum of the variances of each
reading. The standard deviation of titrant volume is:
σ V = ( 0.02) + ( 0.02) = 0.03
2
2
The standard deviation for the final result is larger than the standard deviations of the individual
burette readings, although the volume is calculated as the difference, but it is less than the sum
of the standard deviations.
Sometimes, calculations produce nonconstant variance from measurements that have constant variance.
Another look at titration errors will show how this happens.
Example 10.2
The concentration of a water specimen is measured by titration as C = 20(y 2 − y 1 ) where y 1 and
y 2 are initial and final burette readings. The coefficient 20 converts milliliters of titrant used ( y 2 − y 1 )
2
into a concentration (mg/L). Assuming the variance of a burette reading σ y is constant for all y,
© 2002 By CRC Press LLC