
Page 89 - Statistics for Environmental Engineers
P. 89
L1592_Frame_C09 Page 82 Tuesday, December 18, 2001 1:45 PM
TABLE 9.1
Youden Pairs from Eight Laboratories
Low High
Lab (2.0 µµ µµg/L) (6.2 µµ µµg/L) d i
1 2.0 6.3 4.3
2 3.6 6.6 3.0
3 1.8 6.8 5.0
4 1.1 6.8 5.7
5 2.5 7.4 4.9
6 2.4 6.9 4.5
7 1.8 6.1 4.4
8 10 1.7 radius = s ¥ t 4.6
6.3
Measured on the 6.2-µg/L Specimen 8 Average = 2.11 mg/L
= 0.545(2.365) = 1.3
Average = 6.66 µg/L
6
4
2
0
0
2
8
10
4
6
Measured on the 2.0-mg/L Specimen
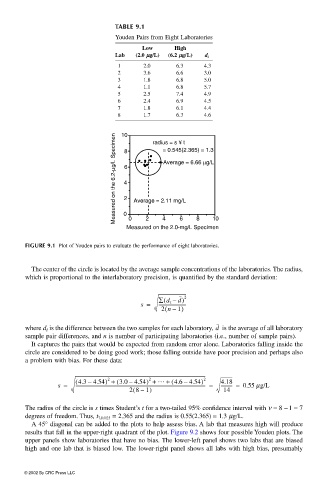
FIGURE 9.1 Plot of Youden pairs to evaluate the performance of eight laboratories.
The center of the circle is located by the average sample concentrations of the laboratories. The radius,
which is proportional to the interlaboratory precision, is quantified by the standard deviation:
∑ d i –( d) 2
s = -------------------------
(
2 n 1)
–
where d I is the difference between the two samples for each laboratory, is the average of all laboratoryd
sample pair differences, and n is number of participating laboratories (i.e., number of sample pairs).
It captures the pairs that would be expected from random error alone. Laboratories falling inside the
circle are considered to be doing good work; those falling outside have poor precision and perhaps also
a problem with bias. For these data:
( 4.3 4.54) + ( 3.0 4.54) + … + ( 4.6 4.54) 2 4.18
2
2
–
–
–
s = --------------------------------------------------------------------------------------------------------------------- = ---------- = 0.55 µg/L
(
28 1) 14
–
The radius of the circle is s times Student’s t for a two-tailed 95% confidence interval with ν = 8 − 1 = 7
degrees of freedom. Thus, t 7,0.025 = 2.365 and the radius is 0.55(2.365) = 1.3 µg/L.
A 45° diagonal can be added to the plots to help assess bias. A lab that measures high will produce
results that fall in the upper-right quadrant of the plot. Figure 9.2 shows four possible Youden plots. The
upper panels show laboratories that have no bias. The lower-left panel shows two labs that are biased
high and one lab that is biased low. The lower-right panel shows all labs with high bias, presumably
© 2002 By CRC Press LLC