
Page 86 - Statistics for Environmental Engineers
P. 86
L1592_Frame_C09 Page 79 Tuesday, December 18, 2001 1:45 PM
When confidence limits are calculated, there is no point in giving the value of ts/ n to more than two
significant figures. The value of should be given the corresponding number of decimal places.
y
When several measured quantities are be used to calculate a final result, these quantities should not
be rounded off too much or a needless loss of precision will result. A good rule is to keep one digit
beyond the last significant figure and leave further rounding until the final result is reached. This same
advice applies when the mean and standard deviation are to be used in a statistical test such as the F-
and t-tests; the unrounded values of and s should be used.y
Relative Errors
The coefficient of variation (CV), also known as the relative standard deviation (RSD), is defined by
y
s/ . The CV or RSD, expressed as a decimal fraction or as a percent, is a relative error. A relative error
implies a proportional error; that is, random errors that are proportional to the magnitude of the measured
values. Errors of this kind are common in environmental data. Coliform bacterial counts are one example.
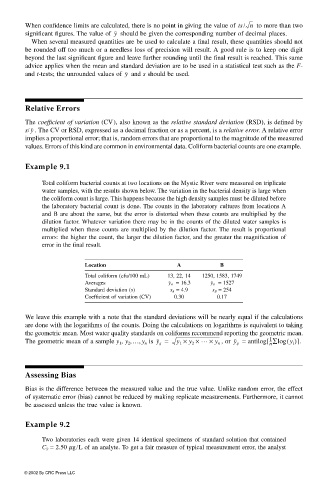
Example 9.1
Total coliform bacterial counts at two locations on the Mystic River were measured on triplicate
water samples, with the results shown below. The variation in the bacterial density is large when
the coliform count is large. This happens because the high density samples must be diluted before
the laboratory bacterial count is done. The counts in the laboratory cultures from locations A
and B are about the same, but the error is distorted when these counts are multiplied by the
dilution factor. Whatever variation there may be in the counts of the diluted water samples is
multiplied when these counts are multiplied by the dilution factor. The result is proportional
errors: the higher the count, the larger the dilution factor, and the greater the magnification of
error in the final result.
Location A B
Total coliform (cfu/100 mL) 13, 22, 14 1250, 1583, 1749
Averages y A = 16.3 y B = 1527
Standard deviation (s) s A = 4.9 s B = 254
Coefficient of variation (CV) 0.30 0.17
We leave this example with a note that the standard deviations will be nearly equal if the calculations
are done with the logarithms of the counts. Doing the calculations on logarithms is equivalent to taking
the geometric mean. Most water quality standards on coliforms recommend reporting the geometric mean.
[
The geometric mean of a sample y 1 , y 2 ,…, y n is y g = y 1 × y 2 × … × = antilog --∑log ()] .
1
y n
, or y g
n y i
Assessing Bias
Bias is the difference between the measured value and the true value. Unlike random error, the effect
of systematic error (bias) cannot be reduced by making replicate measurements. Furthermore, it cannot
be assessed unless the true value is known.
Example 9.2
Two laboratories each were given 14 identical specimens of standard solution that contained
C S = 2.50 µg/L of an analyte. To get a fair measure of typical measurement error, the analyst
© 2002 By CRC Press LLC