
Page 82 - Statistics for Environmental Engineers
P. 82
L1592_frame_C08 Page 74 Tuesday, December 18, 2001 1:45 PM
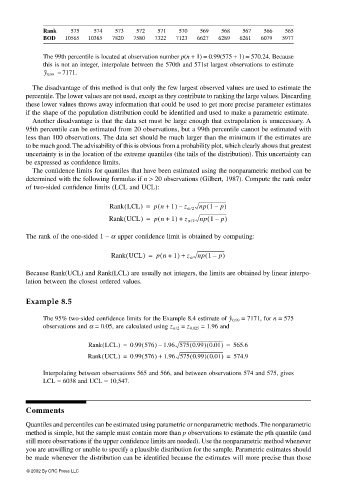
Rank 575 574 573 572 571 570 569 568 567 566 565
BOD 10565 10385 7820 7580 7322 7123 6627 6289 6261 6079 5977
The 99th percentile is located at observation number p(n + 1) = 0.99(575 + 1) = 570.24. Because
this is not an integer, interpolate between the 570th and 571st largest observations to estimate
= 7171.
y ˆ 0.99
The disadvantage of this method is that only the few largest observed values are used to estimate the
percentile. The lower values are not used, except as they contribute to ranking the large values. Discarding
these lower values throws away information that could be used to get more precise parameter estimates
if the shape of the population distribution could be identified and used to make a parametric estimate.
Another disadvantage is that the data set must be large enough that extrapolation is unnecessary. A
95th percentile can be estimated from 20 observations, but a 99th percentile cannot be estimated with
less than 100 observations. The data set should be much larger than the minimum if the estimates are
to be much good. The advisability of this is obvious from a probability plot, which clearly shows that greatest
uncertainty is in the location of the extreme quantiles (the tails of the distribution). This uncertainty can
be expressed as confidence limits.
The confidence limits for quantiles that have been estimated using the nonparametric method can be
determined with the following formulas if n > 20 observations (Gilbert, 1987). Compute the rank order
of two-sided confidence limits (LCL and UCL):
(
Rank LCL) = pn + 1) – z α /2 np 1 – p)
(
(
Rank UCL) = pn + 1) + z α /2 np 1 –( p)
(
(
The rank of the one-sided 1 – α upper confidence limit is obtained by computing:
Rank UCL) = pn + 1) + z α np 1 – p)
(
(
(
Because Rank(UCL) and Rank(LCL) are usually not integers, the limits are obtained by linear interpo-
lation between the closest ordered values.
Example 8.5
= 7171, for n = 575
The 95% two-sided confidence limits for the Example 8.4 estimate of y ˆ 0.99
observations and α = 0.05, are calculated using z α /2 = z 0.025 = 1.96 and
Rank LCL) = 0.99 576) 1.96 575 0.99) 0.01) = 565.6
(
(
(
(
–
(
(
Rank UCL) = 0.99 576) + 1.96 575 0.99) 0.01) = 574.9
(
(
Interpolating between observations 565 and 566, and between observations 574 and 575, gives
LCL = 6038 and UCL = 10,547.
Comments
Quantiles and percentiles can be estimated using parametric or nonparametric methods. The nonparametric
method is simple, but the sample must contain more than p observations to estimate the pth quantile (and
still more observations if the upper confidence limits are needed). Use the nonparametric method whenever
you are unwilling or unable to specify a plausible distribution for the sample. Parametric estimates should
be made whenever the distribution can be identified because the estimates will more precise than those
© 2002 By CRC Press LLC