
Page 77 - Statistics for Environmental Engineers
P. 77
L1592_frame_C07.fm Page 69 Tuesday, December 18, 2001 1:44 PM
λ =- 0.5
1/ √ y
/
2 4 6 8 10 12 14 16
λ =0
y
0.00 0.02 0.04 0.06 0.08 0.10
λ = 0.5
√ y
0.0 0.1 0.2 0.3 0.4
λ =1
In (y)
-6 -5 -4 -3 -2
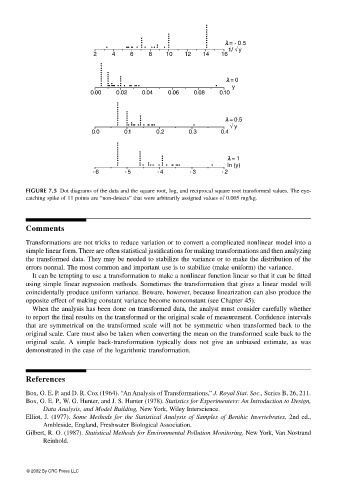
FIGURE 7.5 Dot diagrams of the data and the square root, log, and reciprocal square root transformed values. The eye-
catching spike of 11 points are “non-detects” that were arbitrarily assigned values of 0.005 mg/kg.
Comments
Transformations are not tricks to reduce variation or to convert a complicated nonlinear model into a
simple linear form. There are often statistical justifications for making transformations and then analyzing
the transformed data. They may be needed to stabilize the variance or to make the distribution of the
errors normal. The most common and important use is to stabilize (make uniform) the variance.
It can be tempting to use a transformation to make a nonlinear function linear so that it can be fitted
using simple linear regression methods. Sometimes the transformation that gives a linear model will
coincidentally produce uniform variance. Beware, however, because linearization can also produce the
opposite effect of making constant variance become nonconstant (see Chapter 45).
When the analysis has been done on transformed data, the analyst must consider carefully whether
to report the final results on the transformed or the original scale of measurement. Confidence intervals
that are symmetrical on the transformed scale will not be symmetric when transformed back to the
original scale. Care must also be taken when converting the mean on the transformed scale back to the
original scale. A simple back-transformation typically does not give an unbiased estimate, as was
demonstrated in the case of the logarithmic transformation.
References
Box, G. E. P. and D. R. Cox (1964). “An Analysis of Transformations,” J. Royal Stat. Soc., Series B, 26, 211.
Box, G. E. P., W. G. Hunter, and J. S. Hunter (1978). Statistics for Experimenters: An Introduction to Design,
Data Analysis, and Model Building, New York, Wiley Interscience.
Elliot, J. (1977). Some Methods for the Statistical Analysis of Samples of Benthic Invertebrates, 2nd ed.,
Ambleside, England, Freshwater Biological Association.
Gilbert, R. O. (1987). Statistical Methods for Environmental Pollution Monitoring, New York, Van Nostrand
Reinhold.
© 2002 By CRC Press LLC