
Page 72 - Statistics for Environmental Engineers
P. 72
L1592_frame_C07.fm Page 64 Tuesday, December 18, 2001 1:44 PM
10
Station 1
0
10
Station 2
0
10
Frequency Station 3
0
10
Station 4
0
10
Station 5
0
0 4 8 12 16 0 1 2 3 4
Plankton Count Count + 0.5
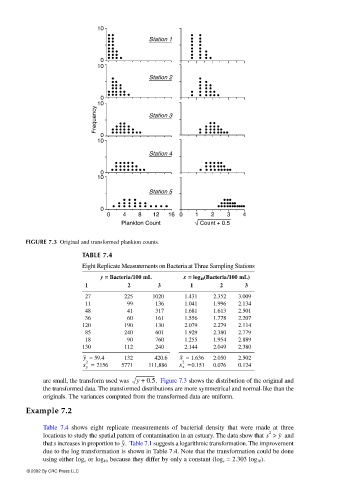
FIGURE 7.3 Original and transformed plankton counts.
TABLE 7.4
Eight Replicate Measurements on Bacteria at Three Sampling Stations
y == == Bacteria/100 mL x == == log 10 (Bacteria/100 mL)
1 2 3 1 2 3
27 225 1020 1.431 2.352 3.009
11 99 136 1.041 1.996 2.134
48 41 317 1.681 1.613 2.501
36 60 161 1.556 1.778 2.207
120 190 130 2.079 2.279 2.114
85 240 601 1.929 2.380 2.779
18 90 760 1.255 1.954 2.889
130 112 240 2.144 2.049 2.380
y = 59.4 132 420.6 x = 1.636 2.050 2.502
2 2
s y = 2156 5771 111,886 s x = 0.151 0.076 0.124
are small, the transform used was y + 0.5. Figure 7.3 shows the distribution of the original and
the transformed data. The transformed distributions are more symmetrical and normal-like than the
originals. The variances computed from the transformed data are uniform.
Example 7.2
Table 7.4 shows eight replicate measurements of bacterial density that were made at three
locations to study the spatial pattern of contamination in an estuary. The data show that s > y and
2
that s increases in proportion to y. Table 7.1 suggests a logarithmic transformation. The improvement
due to the log transformation is shown in Table 7.4. Note that the transformation could be done
using either log e or log 10 because they differ by only a constant (log e = 2.303 log 10 ).
© 2002 By CRC Press LLC