
Page 71 - Statistics for Environmental Engineers
P. 71
L1592_frame_C07.fm Page 63 Tuesday, December 18, 2001 1:44 PM
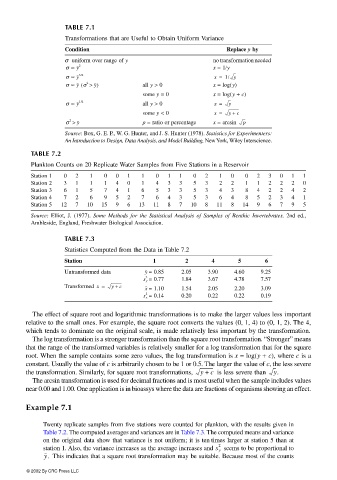
TABLE 7.1
Transformations that are Useful to Obtain Uniform Variance
Condition Replace y by
σ uniform over range of y no transformation needed
σ ∝ y 2 x = 1/y
σ ∝ y 3/2 x = 1/ y
2
(
σ ∝ y σ > y) all y > 0 x = log(y)
some y = 0 x = log(y + c)
σ ∝ y 1/2 all y > 0 x = y
some y < 0 x = y + c
σ > y p = ratio or percentage x = arcsin p
2
Source: Box, G. E. P., W. G. Hunter, and J. S. Hunter (1978). Statistics for Experimenters:
An Introduction to Design, Data Analysis, and Model Building, New York, Wiley Interscience.
TABLE 7.2
Plankton Counts on 20 Replicate Water Samples from Five Stations in a Reservoir
Station 1 0 2 1 0 0 1 1 0 1 1 0 2 1 0 0 2 3 0 1 1
Station 2 3 1 1 1 4 0 1 4 3 3 5 3 2 2 1 1 2 2 2 0
Station 3 6 1 5 7 4 1 6 5 3 3 5 3 4 3 8 4 2 2 4 2
Station 4 7 2 6 9 5 2 7 6 4 3 5 3 6 4 8 5 2 3 4 1
Station 5 12 7 10 15 9 6 13 11 8 7 10 8 11 8 14 9 6 7 9 5
Source: Elliot, J. (1977). Some Methods for the Statistical Analysis of Samples of Benthic Invertebrates, 2nd ed.,
Ambleside, England, Freshwater Biological Association.
TABLE 7.3
Statistics Computed from the Data in Table 7.2
Station 1 2 4 5 6
Untransformed data y = 0.85 2.05 3.90 4.60 9.25
s y 2 = 0.77 1.84 3.67 4.78 7.57
Transformed x = y + c x = 1.10 1.54 2.05 2.20 3.09
s x 2 = 0.14 0.20 0.22 0.22 0.19
The effect of square root and logarithmic transformations is to make the larger values less important
relative to the small ones. For example, the square root converts the values (0, 1, 4) to (0, 1, 2). The 4,
which tends to dominate on the original scale, is made relatively less important by the transformation.
The log transformation is a stronger transformation than the square root transformation. “Stronger” means
that the range of the transformed variables is relatively smaller for a log transformation that for the square
root. When the sample contains some zero values, the log transformation is x = log(y + c), where c is a
constant. Usually the value of c is arbitrarily chosen to be 1 or 0.5. The larger the value of c, the less severe
the transformation. Similarly, for square root transformations, y + c is less severe than y.
The arcsin transformation is used for decimal fractions and is most useful when the sample includes values
near 0.00 and 1.00. One application is in bioassys where the data are fractions of organisms showing an effect.
Example 7.1
Twenty replicate samples from five stations were counted for plankton, with the results given in
Table 7.2. The computed averages and variances are in Table 7.3. The computed means and variance
on the original data show that variance is not uniform; it is ten times larger at station 5 than at
2
station 1. Also, the variance increases as the average increases and s y seems to be proportional to
y. This indicates that a square root transformation may be suitable. Because most of the counts
© 2002 By CRC Press LLC