Page 66 - Statistics for Environmental Engineers
P. 66

L1592_frame_C06  Page 58  Tuesday, December 18, 2001  1:43 PM


                                           15
                                          Percentage  10          All days


                                            5


                                            0
                                           15

                                          Percentage  10           Stable operation


                                            5

                                            0
                                              0     5   10   15   20   25   30   35
                                                          5-day BOD (mg/L)

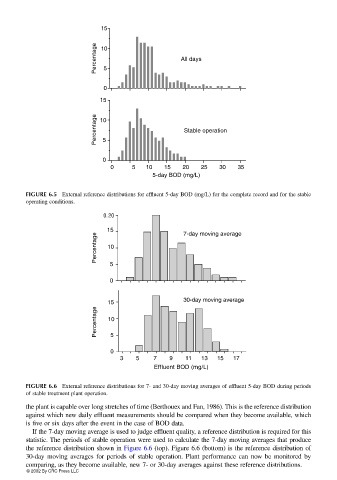
                       FIGURE 6.5  External reference distributions for effluent 5-day BOD (mg/L) for the complete record and for the stable
                       operating conditions.
                                            0.20
                                             15                   7-day moving average
                                          Percentage  10


                                              5

                                              0


                                             15                   30-day moving average
                                          Percentage  10


                                              5

                                              0
                                                 3        5         7        9        11      13      15      17
                                                          Effluent BOD (mg/L)


                       FIGURE 6.6  External reference distributions for 7- and 30-day moving averages of effluent 5-day BOD during periods
                       of stable treatment plant operation.
                       the plant is capable over long stretches of time (Berthouex and Fan, 1986). This is the reference distribution
                       against which new daily effluent measurements should be compared when they become available, which
                       is five or six days after the event in the case of BOD data.
                        If the 7-day moving average is used to judge effluent quality, a reference distribution is required for this
                       statistic. The periods of stable operation were used to calculate the 7-day moving averages that produce
                       the reference distribution shown in Figure 6.6 (top). Figure 6.6 (bottom) is the reference distribution of
                       30-day moving  averages for periods of stable operation. Plant performance can now be monitored by
                       comparing, as they become available, new 7- or 30-day averages against these reference distributions.
                       © 2002 By CRC Press LLC
   61   62   63   64   65   66   67   68   69   70   71