Page 64 - Statistics for Environmental Engineers
P. 64

L1592_frame_C06  Page 56  Tuesday, December 18, 2001  1:43 PM
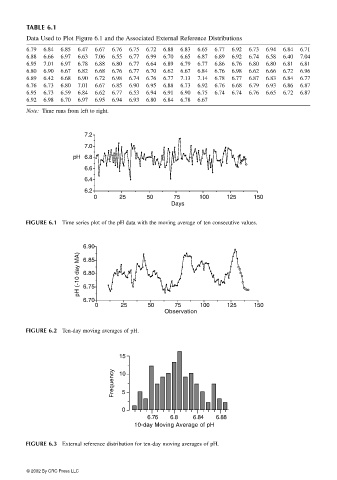


                       TABLE 6.1
                       Data Used to Plot Figure 6.1 and the Associated External Reference Distributions
                       6.79  6.84  6.85  6.47  6.67  6.76  6.75  6.72  6.88  6.83  6.65  6.77  6.92  6.73  6.94  6.84  6.71
                       6.88  6.66  6.97  6.63  7.06  6.55  6.77  6.99  6.70  6.65  6.87  6.89  6.92  6.74  6.58  6.40  7.04
                       6.95  7.01  6.97  6.78  6.88  6.80  6.77  6.64  6.89  6.79  6.77  6.86  6.76  6.80  6.80  6.81  6.81
                       6.80  6.90  6.67  6.82  6.68  6.76  6.77  6.70  6.62  6.67  6.84  6.76  6.98  6.62  6.66  6.72  6.96
                       6.89  6.42  6.68  6.90  6.72  6.98  6.74  6.76  6.77  7.13  7.14  6.78  6.77  6.87  6.83  6.84  6.77
                       6.76  6.73  6.80  7.01  6.67  6.85  6.90  6.95  6.88  6.73  6.92  6.76  6.68  6.79  6.93  6.86  6.87
                       6.95  6.73  6.59  6.84  6.62  6.77  6.53  6.94  6.91  6.90  6.75  6.74  6.74  6.76  6.65  6.72  6.87
                       6.92  6.98  6.70  6.97  6.95  6.94  6.93  6.80  6.84  6.78  6.67
                       Note: Time runs from left to right.


                                       7.2
                                       7.0
                                    pH  6.8
                                       6.6
                                       6.4
                                       6.2
                                         0       25     50      75     100    125     150
                                                               Days

                       FIGURE 6.1  Time series plot of the pH data with the moving average of ten consecutive values.


                                       6.90
                                     pH (-10 day MA)  6.80
                                       6.85


                                       6.75

                                       6.70
                                          0      25     50      75     100    125     150
                                                             Observation

                       FIGURE 6.2  Ten-day moving averages of pH.


                                                 15

                                               Frequency  10


                                                 5

                                                 0
                                                        6.76   6.8   6.84  6.88
                                                     10-day Moving Average of pH


                       FIGURE 6.3  External reference distribution for ten-day moving averages of pH.


                       © 2002 By CRC Press LLC
   59   60   61   62   63   64   65   66   67   68   69