
Page 62 - Statistics for Environmental Engineers
P. 62
L1592_Frame_C05 Page 54 Tuesday, December 18, 2001 1:42 PM
Sokal, R. R. and F. J. Rohlf (1969). Biometry: The Principles and Practice of Statistics in Biological Research,
New York, W.H. Freeman & Co.
U.S. EPA (1973). Monitoring Industrial Wastewater, Washington, D.C.
Exercises
5.1 Normal Distribution. Graphically determine whether the following data could have come
from a normal distribution.
Data Set A 13 21 13 18 27 16 17 18 22 19
15 21 18 20 23 25 5 20 20 21
Data Set B 22 24 19 28 22 23 20 21 25 22
18 21 35 21 36 24 24 23 23 24
5.2 Flow and BOD. What is the distribution of the weekly flow and BOD data in Exercise 3.3?
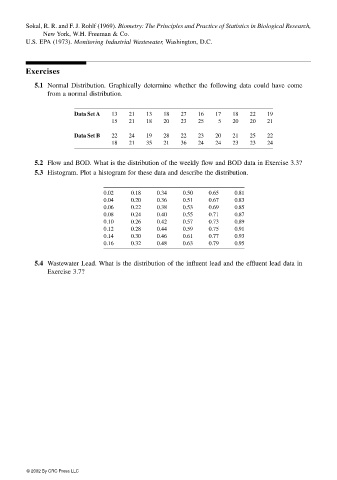
5.3 Histogram. Plot a histogram for these data and describe the distribution.
0.02 0.18 0.34 0.50 0.65 0.81
0.04 0.20 0.36 0.51 0.67 0.83
0.06 0.22 0.38 0.53 0.69 0.85
0.08 0.24 0.40 0.55 0.71 0.87
0.10 0.26 0.42 0.57 0.73 0.89
0.12 0.28 0.44 0.59 0.75 0.91
0.14 0.30 0.46 0.61 0.77 0.93
0.16 0.32 0.48 0.63 0.79 0.95
5.4 Wastewater Lead. What is the distribution of the influent lead and the effluent lead data in
Exercise 3.7?
© 2002 By CRC Press LLC