Page 59 - Statistics for Environmental Engineers
P. 59

L1592_Frame_C05  Page 51  Tuesday, December 18, 2001  1:42 PM


                                        log-transformed data have a        Lognormal distribution
                                            normal distribution

                                 .999
                                Probabitlity .99
                                  .95
                                  .80
                                  .50
                                  .20
                                  .05
                                  .01
                                 .001
                                         0    1    2    3    4     0      20     40      60
                                           log (Concentration)              Concentration


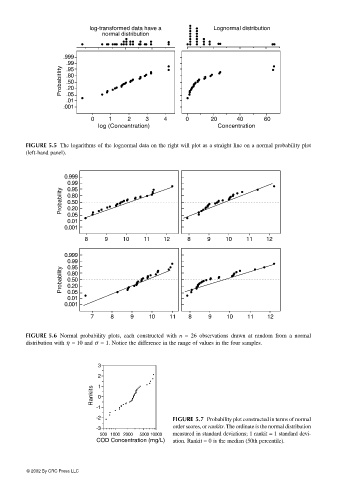
                       FIGURE 5.5 The logarithms of the lognormal data on the right will plot as a straight line on a normal probability plot
                       (left-hand panel).


                                 0.999
                                  0.99
                                  0.95
                                Probability  0.80
                                  0.50
                                  0.20
                                  0.05
                                  0.01
                                 0.001
                                       8     9    10   11    12    8     9    10    11   12

                                 0.999
                                  0.99
                                  0.95
                                Probability  0.80
                                  0.50
                                  0.20
                                  0.05
                                  0.01
                                 0.001

                                         7    8     9    10   11    8    9    10    11    12

                       FIGURE 5.6 Normal probability plots, each constructed with  n  = 26 observations drawn at random from a normal
                       distribution with η = 10 and σ = 1. Notice the difference in the range of values in the four samples.


                                           3
                                           2
                                         Rankits  1 0

                                          -1
                                          -2                   FIGURE 5.7 Probability plot constructed in terms of normal
                                          -3                   order scores, or rankits. The ordinate is the normal distribution
                                           500   1000   2000      5000 10000  measured in standard deviations; 1 rankit = 1 standard devi-
                                          COD Concentration (mg/L)  ation. Rankit = 0 is the median (50th percentile).


                       © 2002 By CRC Press LLC
   54   55   56   57   58   59   60   61   62   63   64