
Page 68 - Statistics for Environmental Engineers
P. 68
L1592_frame_C06 Page 60 Tuesday, December 18, 2001 1:43 PM
compliance. Some might give early warnings while others provide confirmation. Because reference
distributions are easy to construct and use, they should be plentiful and prominent in the control room.
References
Berthouex, P. M. and W. G. Hunter, (1983). “How to Construct a Reference Distribution to Evaluate Treatment
Plant Performance,” J. Water Poll. Cont. Fed., 55, 1417–1424.
Berthouex, P. M. and R. Fan (1986). “Treatment Plant Upsets: Causes, Frequency, and Duration,” J. Water
Poll. Cont. Fed., 58, 368–375.
Exercises
6.1 BOD Tests. The table gives 72 duplicate measurements of wastewater effluent 5-day BOD
measured at 2-hour intervals. (a) Develop reference distrbutions that would be useful to the
plant operator. (b) Develop a reference distribution for the difference between duplicates that
would be useful to the plant chemist.
Time BOD (mg/L) Time BOD (mg/L) Time BOD (mg/L) Time BOD (mg/L)
2 185 193 38 212 203 74 124 118 110 154 139
4 116 119 40 167 158 76 166 157 112 142 129
6 158 156 42 116 118 78 232 225 114 142 137
8 185 181 44 122 129 80 220 207 116 157 174
10 140 135 46 119 116 82 220 214 118 196 197
12 179 174 48 119 124 84 223 210 120 136 124
14 173 169 50 172 166 86 133 123 122 143 138
16 119 119 52 106 105 88 175 156 124 116 108
18 119 116 54 121 124 90 145 132 126 128 123
20 113 112 56 163 162 92 139 132 128 158 161
22 116 115 58 148 140 94 148 130 130 158 150
24 122 110 60 184 184 96 133 125 132 194 190
26 161 171 62 175 172 98 190 185 134 158 148
28 110 116 64 172 166 100 187 174 136 155 145
30 176 166 66 118 117 102 190 171 138 137 129
32 197 191 68 91 98 104 115 102 140 152 148
34 167 165 70 115 108 106 136 127 142 140 127
36 179 178 72 124 119 108 154 141 144 125 113
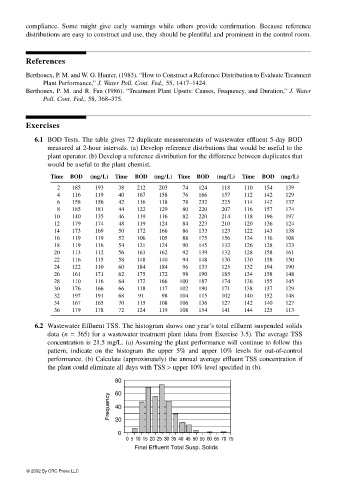
6.2 Wastewater Effluent TSS. The histogram shows one year’s total effluent suspended solids
data (n = 365) for a wastewater treatment plant (data from Exercise 3.5). The average TSS
concentration is 21.5 mg/L. (a) Assuming the plant performance will continue to follow this
pattern, indicate on the histogram the upper 5% and upper 10% levels for out-of-control
performance. (b) Calculate (approximately) the annual average effluent TSS concentration if
the plant could eliminate all days with TSS > upper 10% level specified in (b).
80
Frequency 60
40
20
0
0 5 10 15 20 25 30 35 40 45 50 55 60 65 70 75
Final Effluent Total Susp. Solids
© 2002 By CRC Press LLC