
Page 70 - Statistics for Environmental Engineers
P. 70
L1592_frame_C07.fm Page 62 Tuesday, December 18, 2001 1:44 PM
1200 10000
1000
MPN count 800 1000
600
400
100
200
0 10
0 1 2 3 4 0 1 2 3 4
Time Time
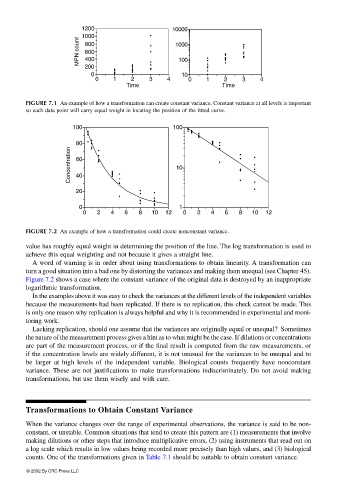
FIGURE 7.1 An example of how a transformation can create constant variance. Constant variance at all levels is important
so each data point will carry equal weight in locating the position of the fitted curve.
100 100
80
Concentration 60 10
40
20
0 1
0 2 4 6 8 10 12 0 2 4 6 8 10 12
FIGURE 7.2 An example of how a transformation could create nonconstant variance.
value has roughly equal weight in determining the position of the line. The log transformation is used to
achieve this equal weighting and not because it gives a straight line.
A word of warning is in order about using transformations to obtain linearity. A transformation can
turn a good situation into a bad one by distorting the variances and making them unequal (see Chapter 45).
Figure 7.2 shows a case where the constant variance of the original data is destroyed by an inappropriate
logarithmic transformation.
In the examples above it was easy to check the variances at the different levels of the independent variables
because the measurements had been replicated. If there is no replication, this check cannot be made. This
is only one reason why replication is always helpful and why it is recommended in experimental and moni-
toring work.
Lacking replication, should one assume that the variances are originally equal or unequal? Sometimes
the nature of the measurement process gives a hint as to what might be the case. If dilutions or concentrations
are part of the measurement process, or if the final result is computed from the raw measurements, or
if the concentration levels are widely different, it is not unusual for the variances to be unequal and to
be larger at high levels of the independent variable. Biological counts frequently have nonconstant
variance. These are not justifications to make transformations indiscriminately. Do not avoid making
transformations, but use them wisely and with care.
Transformations to Obtain Constant Variance
When the variance changes over the range of experimental observations, the variance is said to be non-
constant, or unstable. Common situations that tend to create this pattern are (1) measurements that involve
making dilutions or other steps that introduce multiplicative errors, (2) using instruments that read out on
a log scale which results in low values being recorded more precisely than high values, and (3) biological
counts. One of the transformations given in Table 7.1 should be suitable to obtain constant variance.
© 2002 By CRC Press LLC