
Page 75 - Statistics for Environmental Engineers
P. 75
L1592_frame_C07.fm Page 67 Tuesday, December 18, 2001 1:44 PM
The Box-Cox Power Transformations
A power transformation model developed by Box and Cox (1964) can, so far as possible, satisfy the
conditions of normality and constant variance simultaneously. The method is applicable for almost any
λ ()
kind of statistical model and any kind of transformation. The transformed value Y i of the original vari-
able y i is:
λ
λ () = y i – 1
Y i --------------
–
λ 1
λy g
where y g is the geometric mean of the original data series, and λ expresses the power of the transfor-
mation. The geometric mean is obtained by averaging ln(y) and taking the exponential (antilog) of the
0 () =
result. The special case when λ = 0 is the log transformation: Y i y ln (). λ = −1 is a reciprocal
g
y i
transformation, λ = 1/2 is a square root transformation, and λ = 1 is no transformation. Example
applications of this transformation are given in Box et al. (1978).
Example 7.5
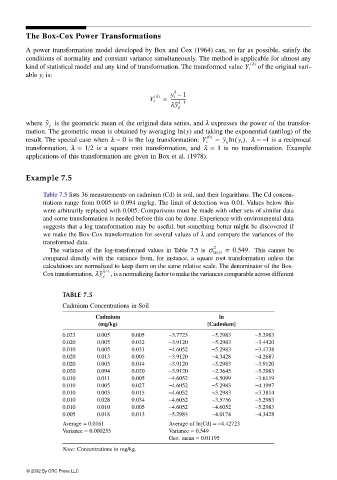
Table 7.5 lists 36 measurements on cadmium (Cd) in soil, and their logarithms. The Cd concen-
trations range from 0.005 to 0.094 mg/kg. The limit of detection was 0.01. Values below this
were arbitrarily replaced with 0.005. Comparisons must be made with other sets of similar data
and some transformation is needed before this can be done. Experience with environmental data
suggests that a log transformation may be useful, but something better might be discovered if
we make the Box-Cox transformation for several values of λ and compare the variances of the
transformed data.
2
The variance of the log-transformed values in Table 7.5 is σ ln y () = 0.549. This cannot be
compared directly with the variance from, for instance, a square root transformation unless the
calculations are normalized to keep them on the same relative scale. The denominator of the Box-
–
g ,
Cox transformation, λy λ 1 is a normalizing factor to make the variances comparable across different
TABLE 7.5
Cadmium Concentrations in Soil
Cadmium ln
(mg/kg) [Cadmium]
0.023 0.005 0.005 −3.7723 −5.2983 −5.2983
0.020 0.005 0.032 −3.9120 −5.2983 −3.4420
0.010 0.005 0.031 −4.6052 −5.2983 −3.4738
0.020 0.013 0.005 −3.9120 −4.3428 −4.2687
0.020 0.005 0.014 −3.9120 −5.2983 −3.9120
0.020 0.094 0.020 −3.9120 −2.3645 −5.2983
0.010 0.011 0.005 −4.6052 −4.5099 −3.6119
0.010 0.005 0.027 −4.6052 −5.2983 −4.1997
0.010 0.005 0.015 −4.6052 −5.2983 −3.3814
0.010 0.028 0.034 −4.6052 −3.5756 −5.2983
0.010 0.010 0.005 −4.6052 −4.6052 −5.2983
0.005 0.018 0.013 −5.2983 −4.0174 −4.3428
Average = 0.0161 Average of ln[Cd] = −4.42723
Variance = 0.000255 Variance = 0.549
Geo. mean = 0.01195
Note: Concentrations in mg/kg.
© 2002 By CRC Press LLC